-
Memory Games

-
Times Tables
- Multiplication Chart
Multiplication Chart – Printable and Online


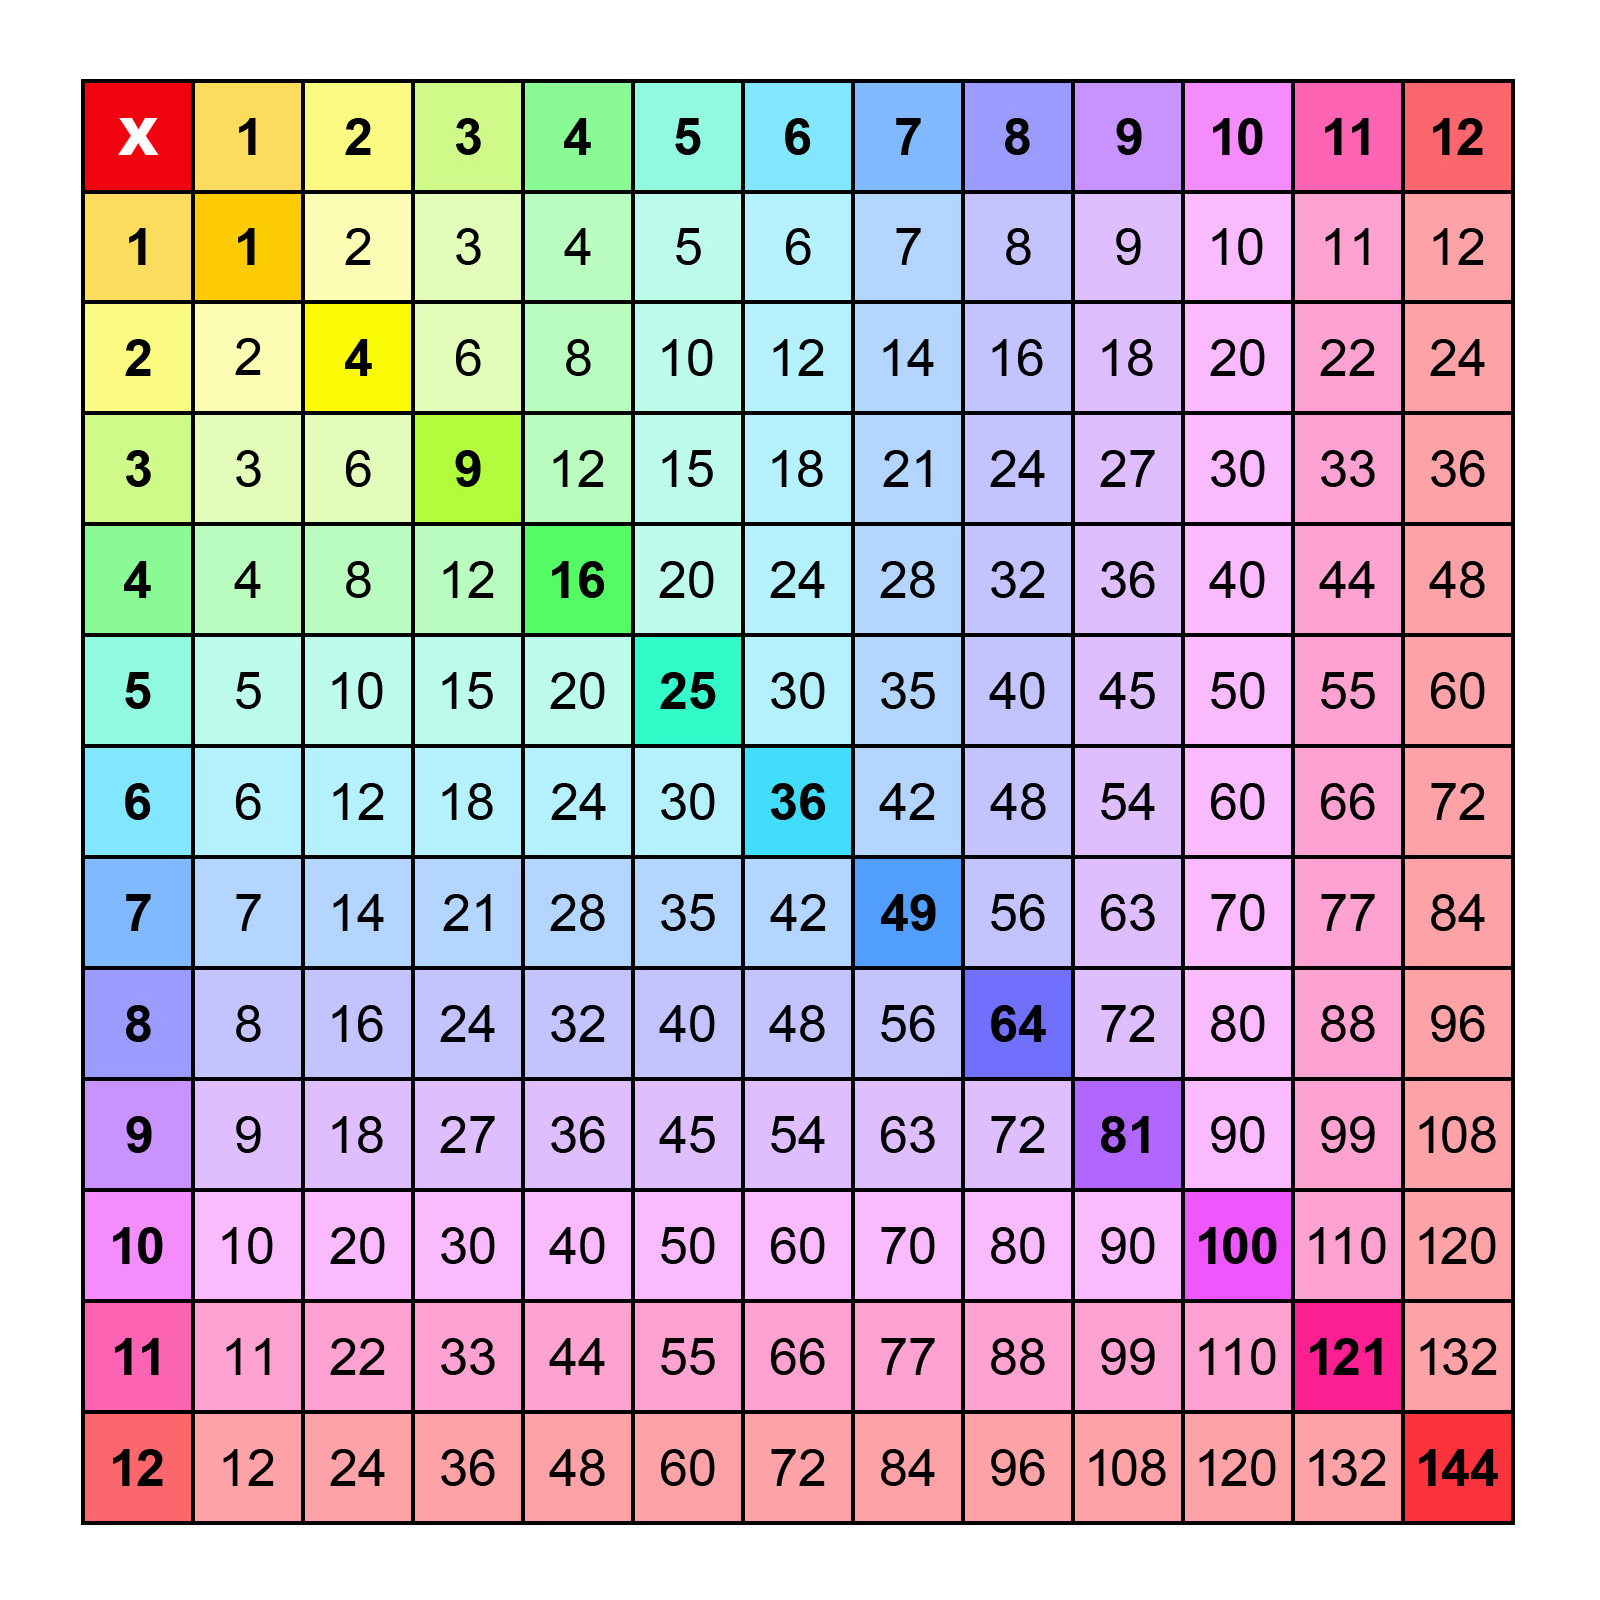
We offer more than 50 free printable multiplication charts in PDF format, as well as an online interactive multiplication chart to make math even more fun!
A multiplication chart, is the go-to tool for learning and reviewing multiplication : simply cross-reference two numbers on the grid to find their result instantly, with no calculation needed. Whether you're learning the times tables at school, reviewing them at home, or just double-checking a calculation, it's a simple yet remarkably effective tool.
Whether you're a parent, teacher, or student, you'll find exactly what you're looking for in our collection:
- Multiple sizes: pick the one that matches your level or needs — 10×10 chart (1 to 10), 12×12 (1 to 12), 15×15 (1 to 15), or 20×20 (1 to 20).
- Filled in or blank: a completed chart works great as a reference tool or wall poster, while a blank chart is perfect for practice and self-testing.
- Color or black & white: color charts boost visual memory; black & white charts let kids add their own colors and make it their own.
Once printed, you can hang the chart on the wall near your desk, slip it into a binder, or tuck it into a notebook.
Printable multiplication charts
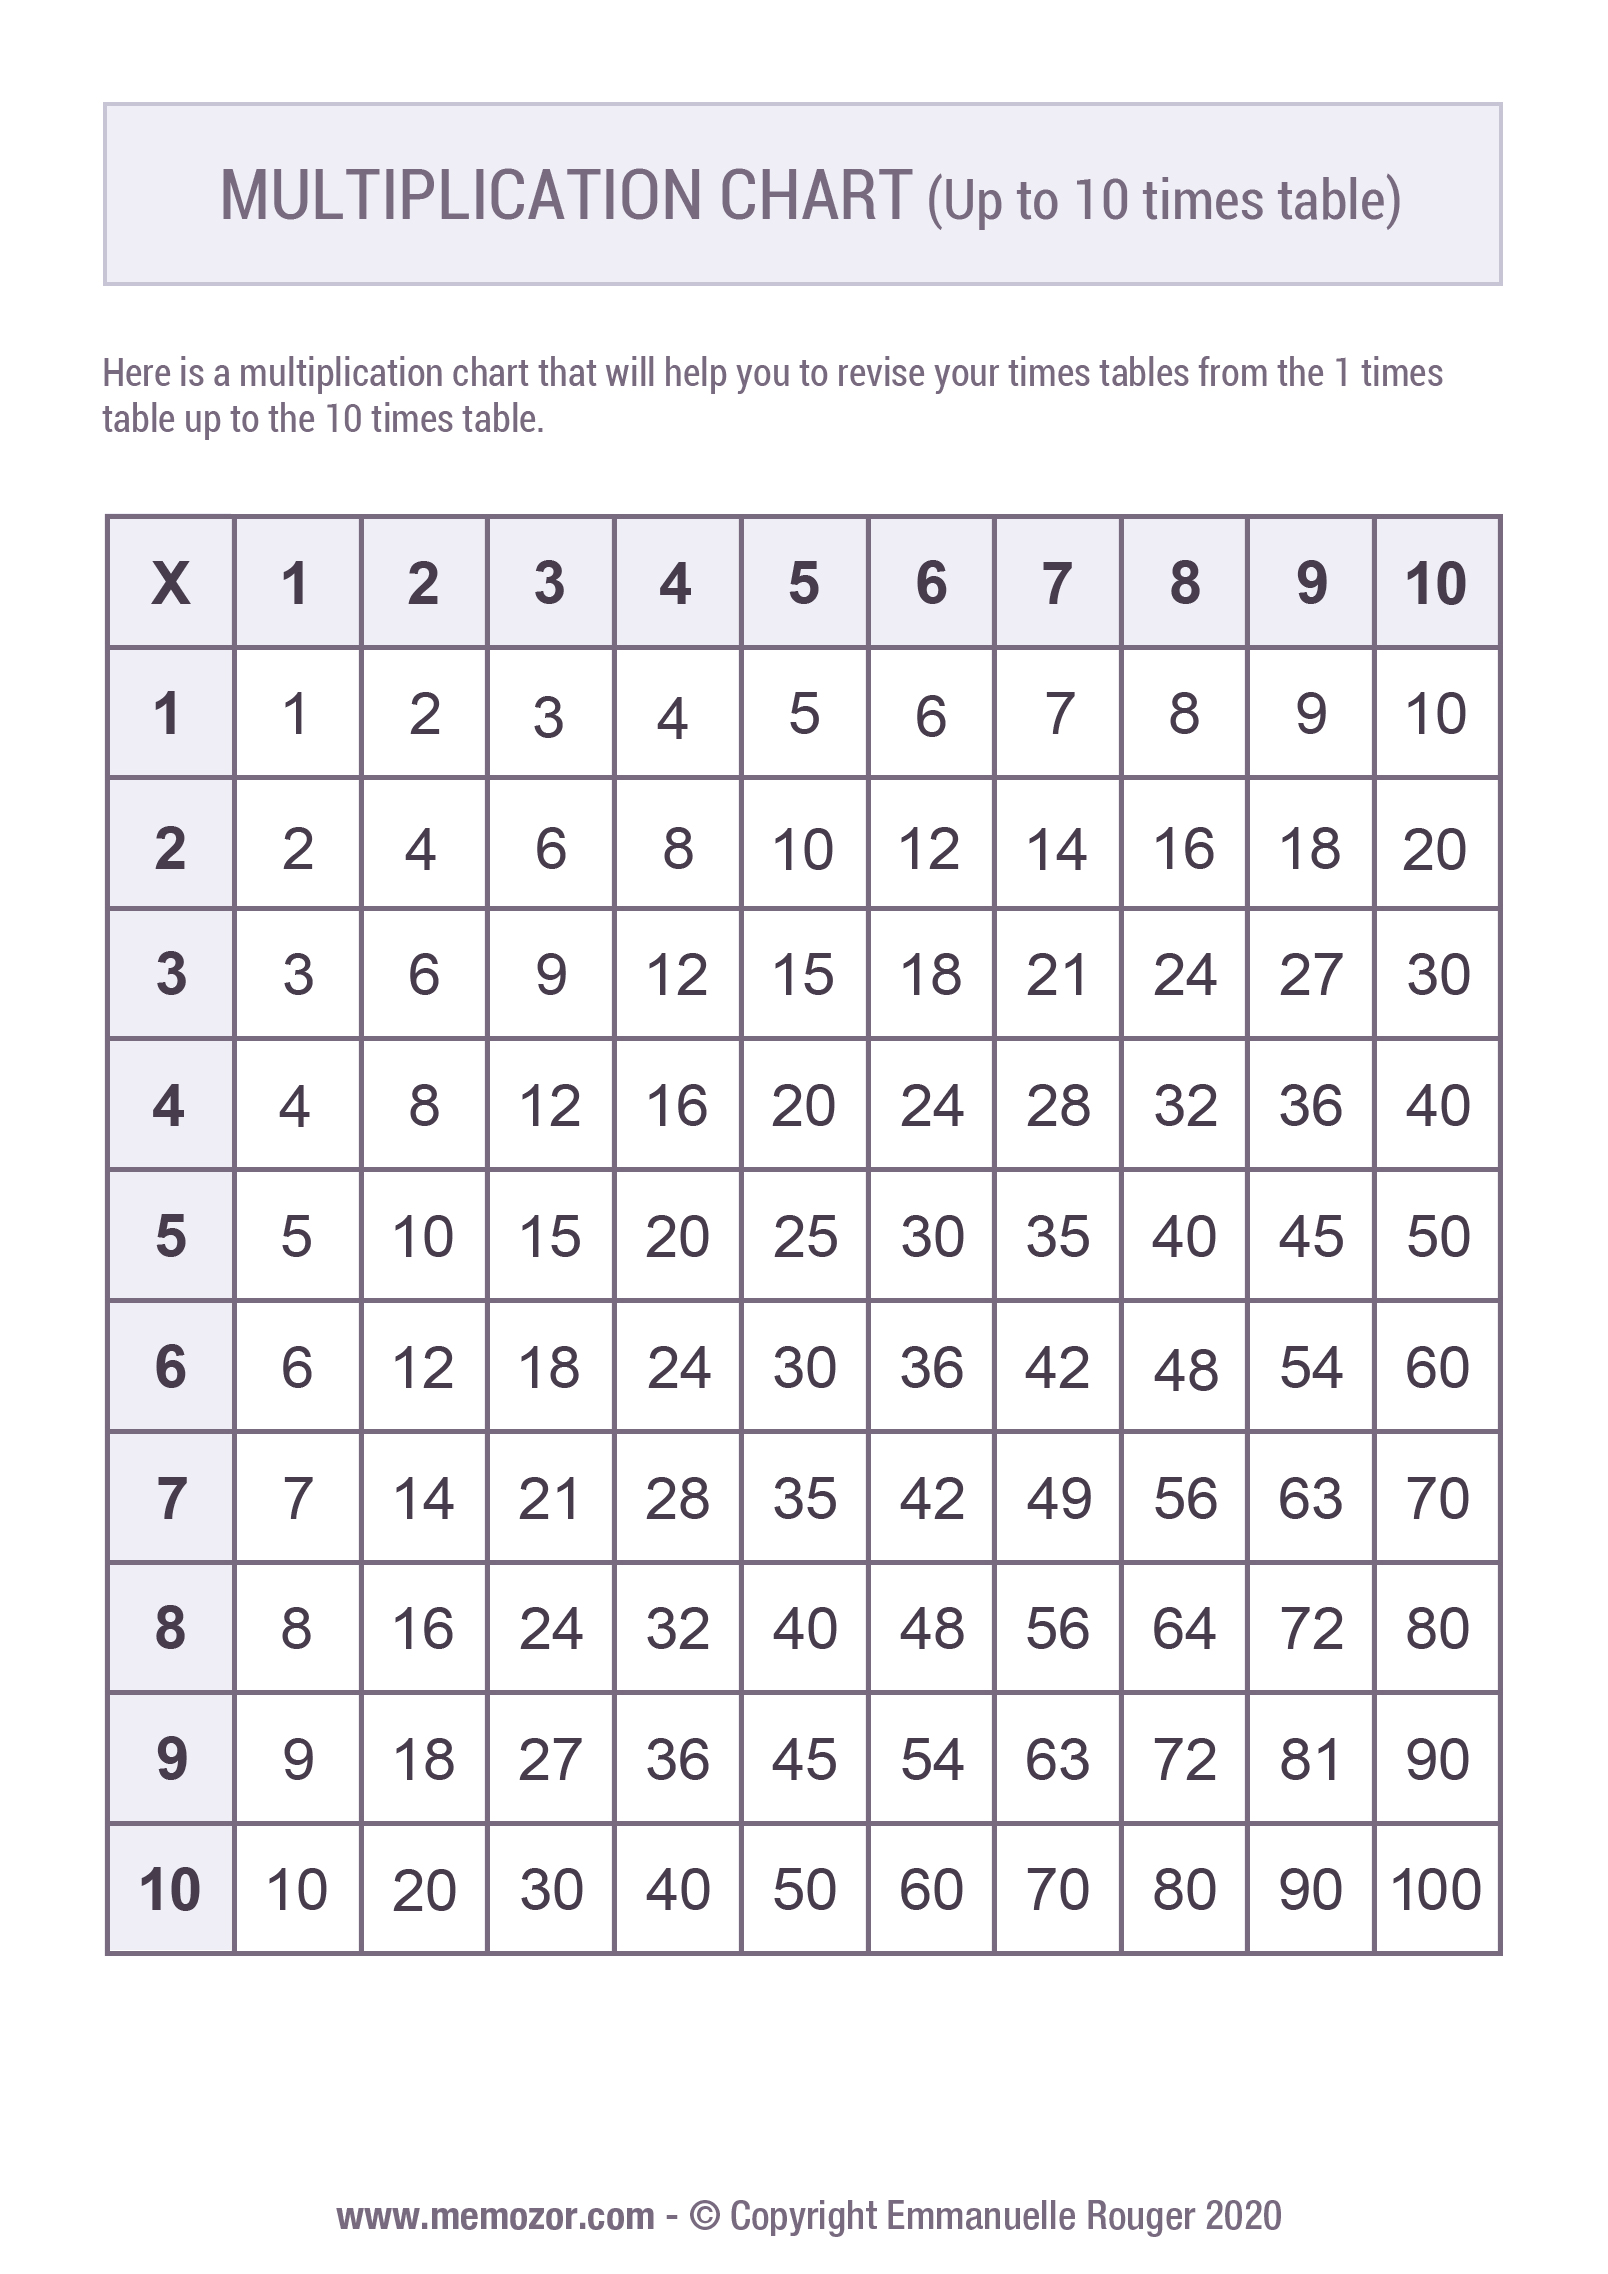
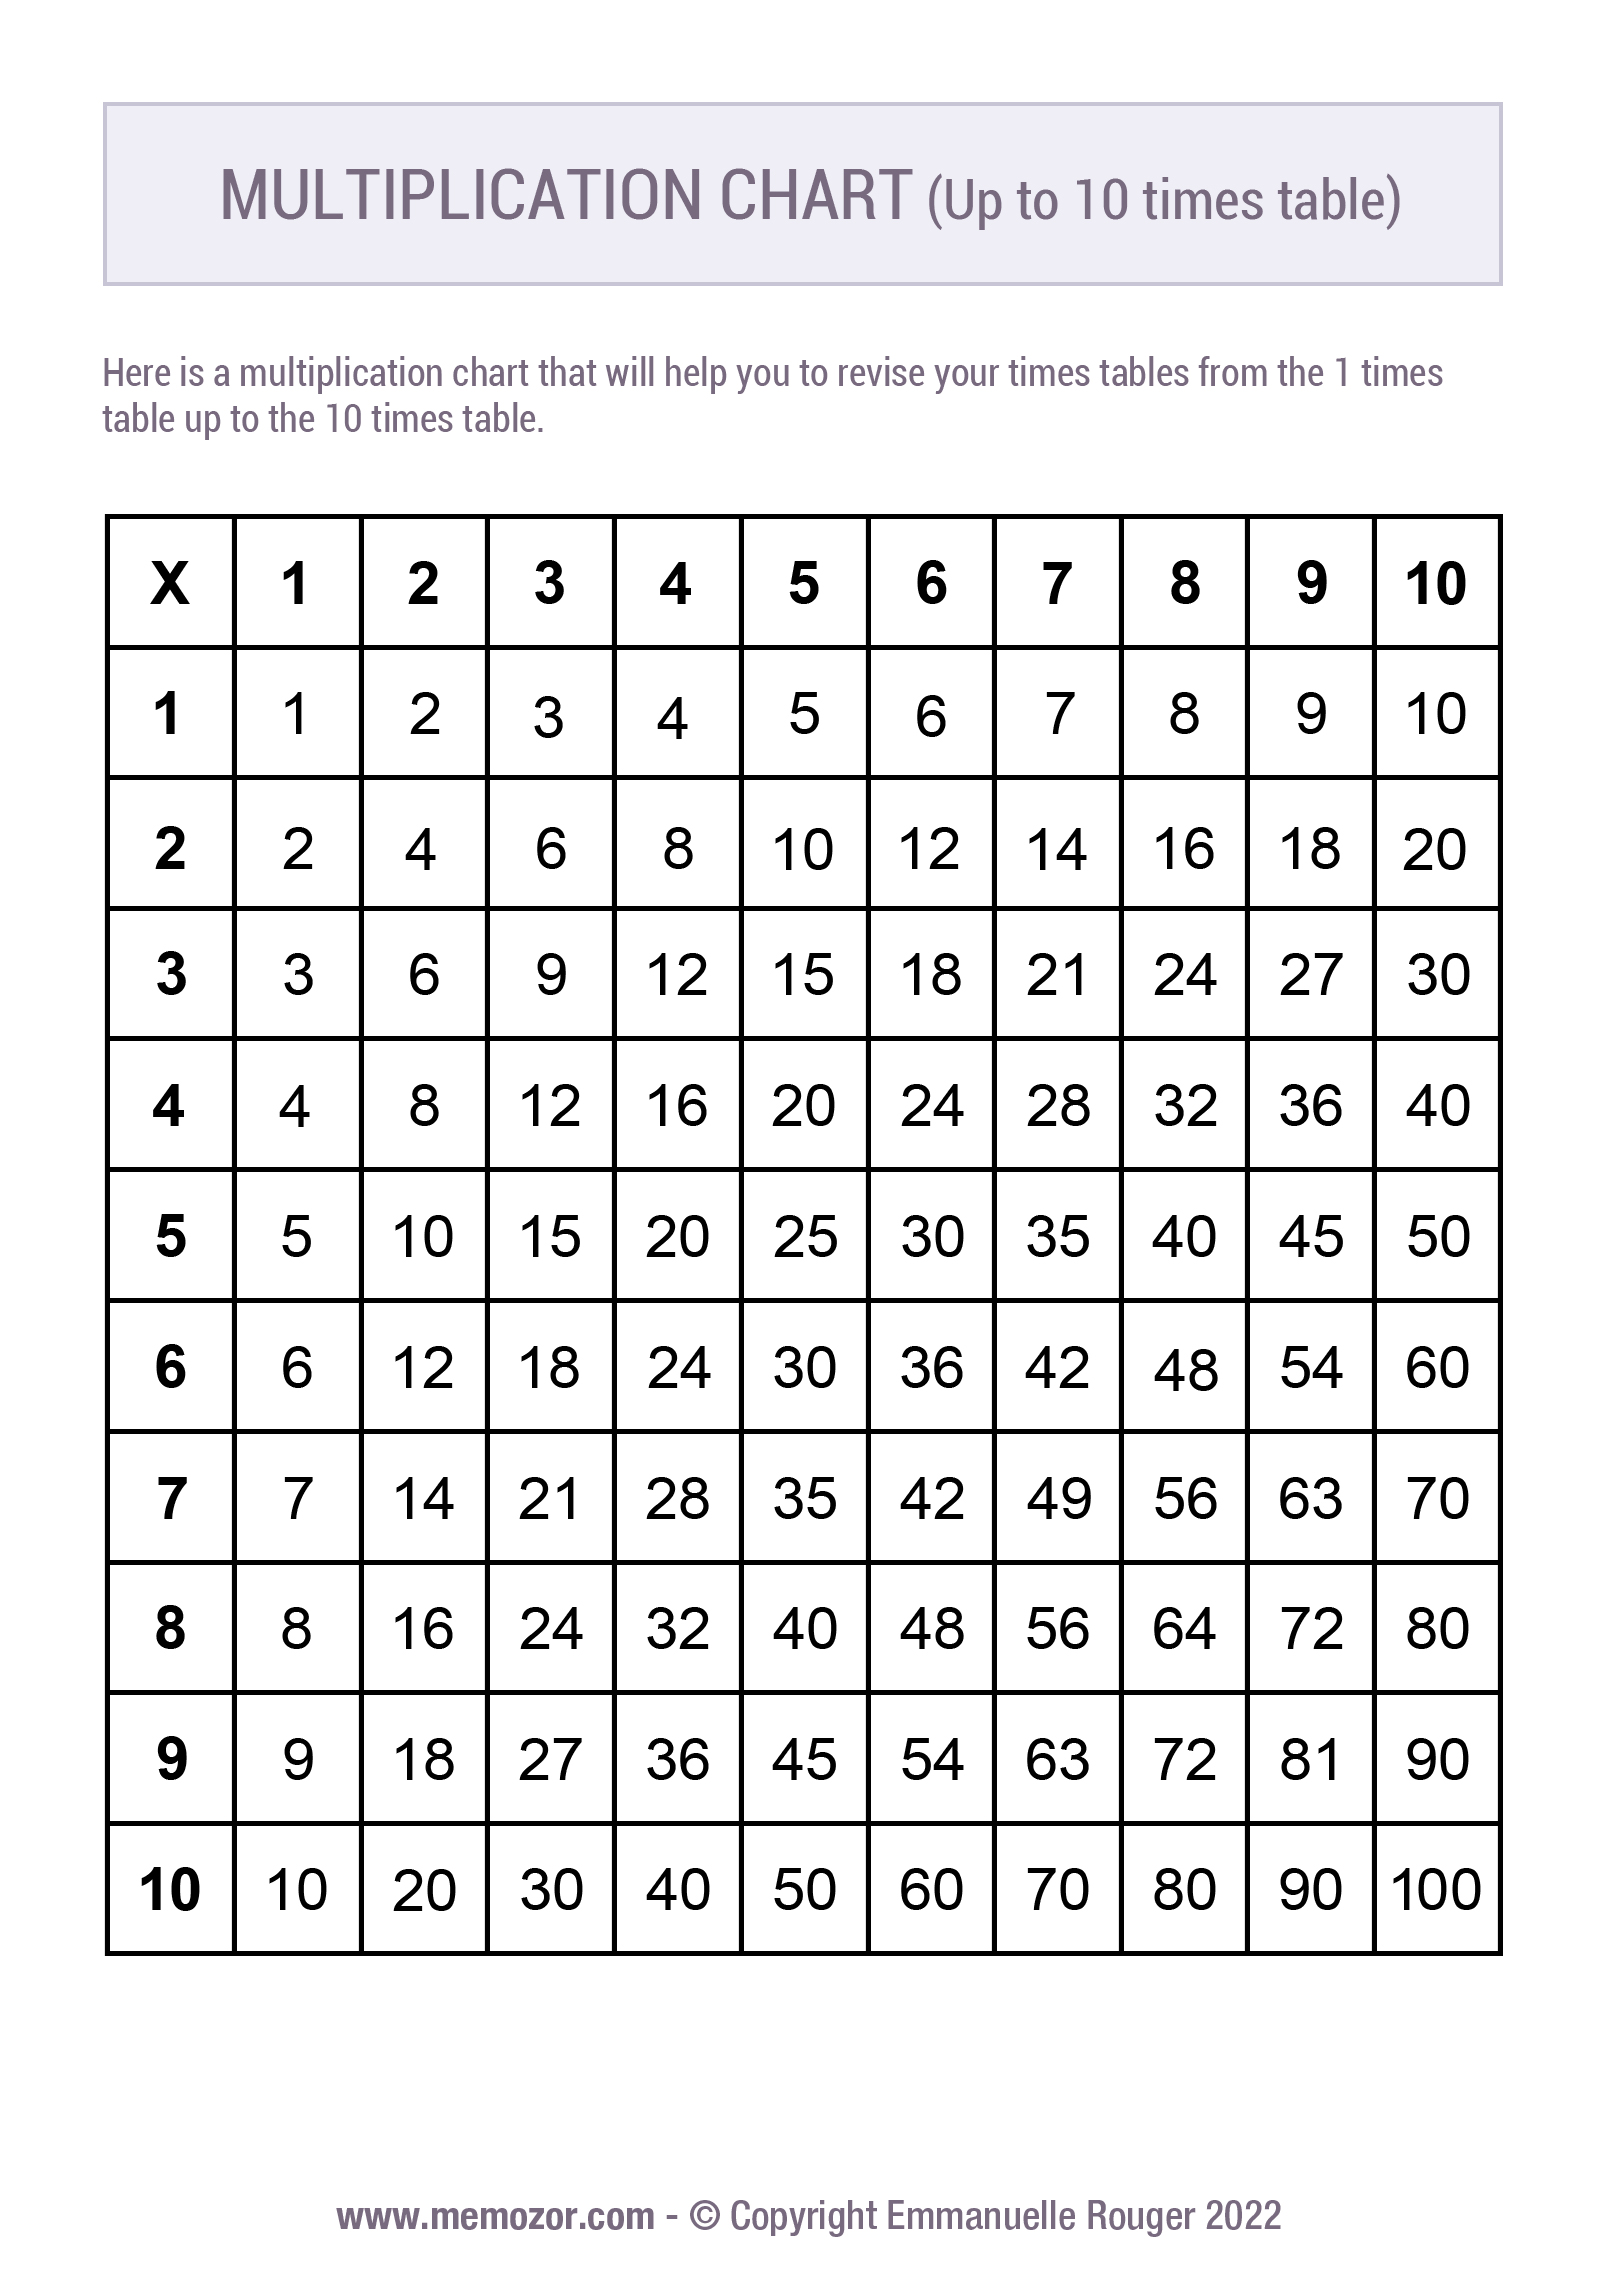
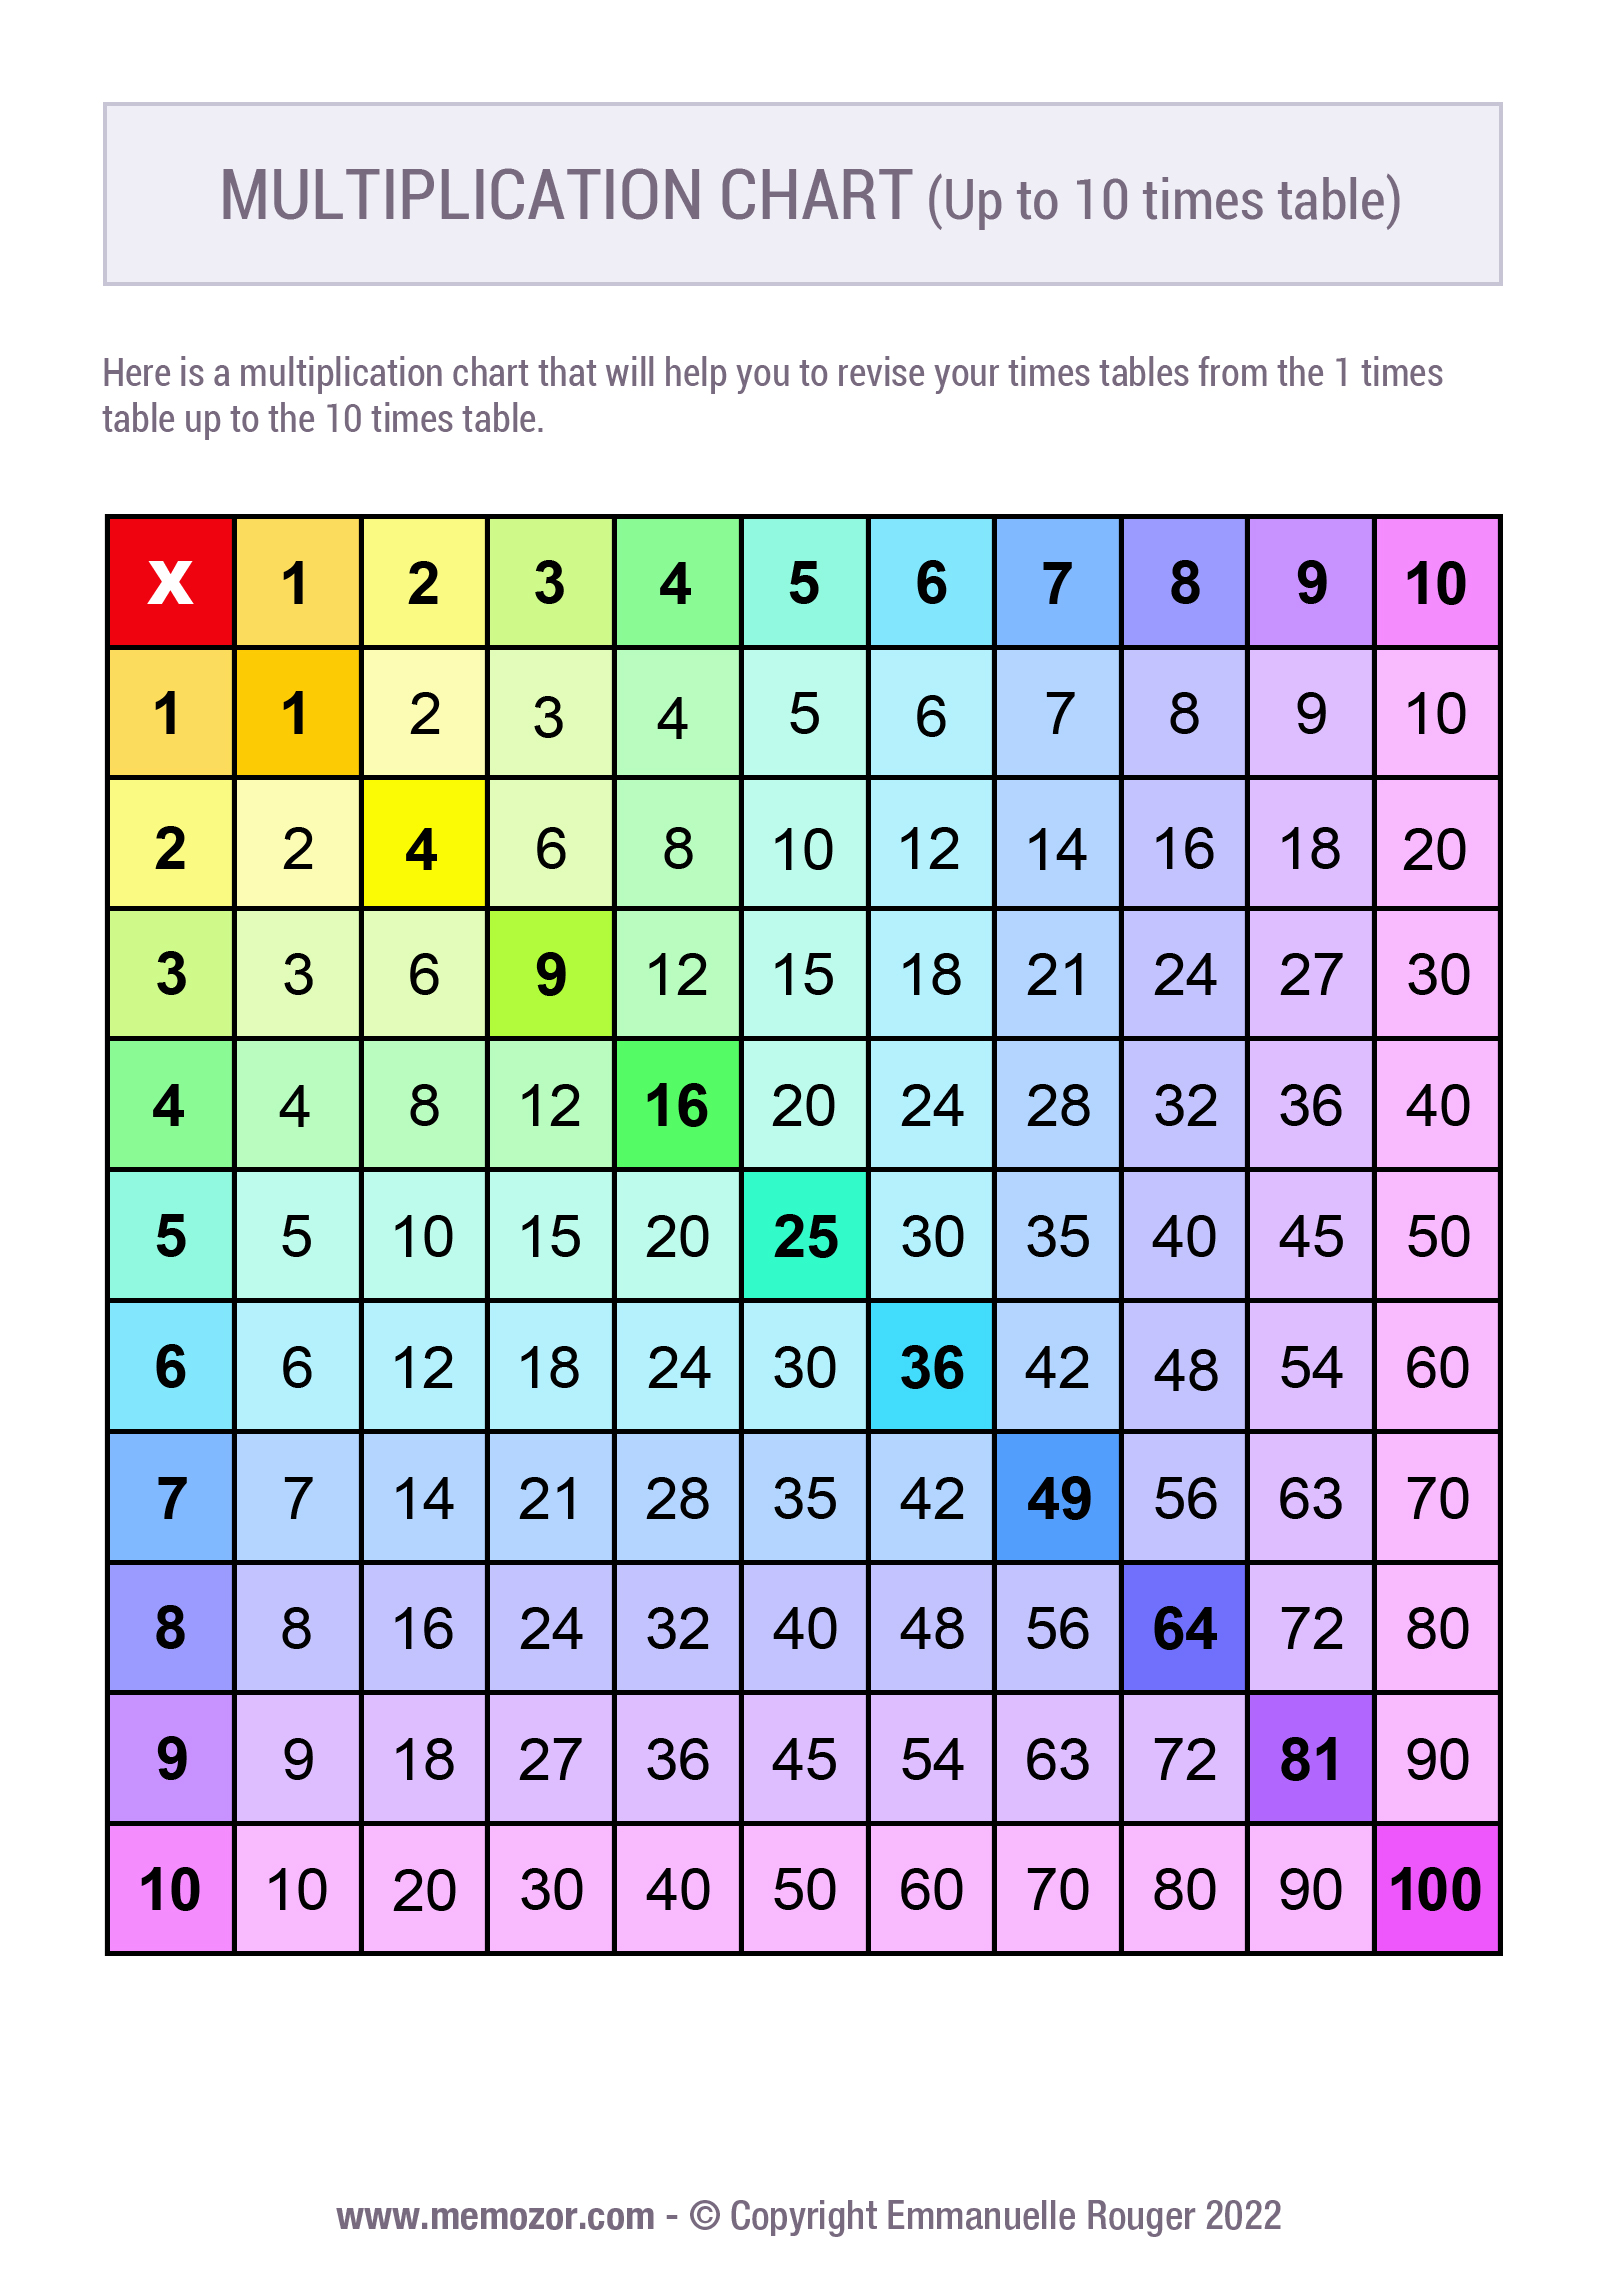
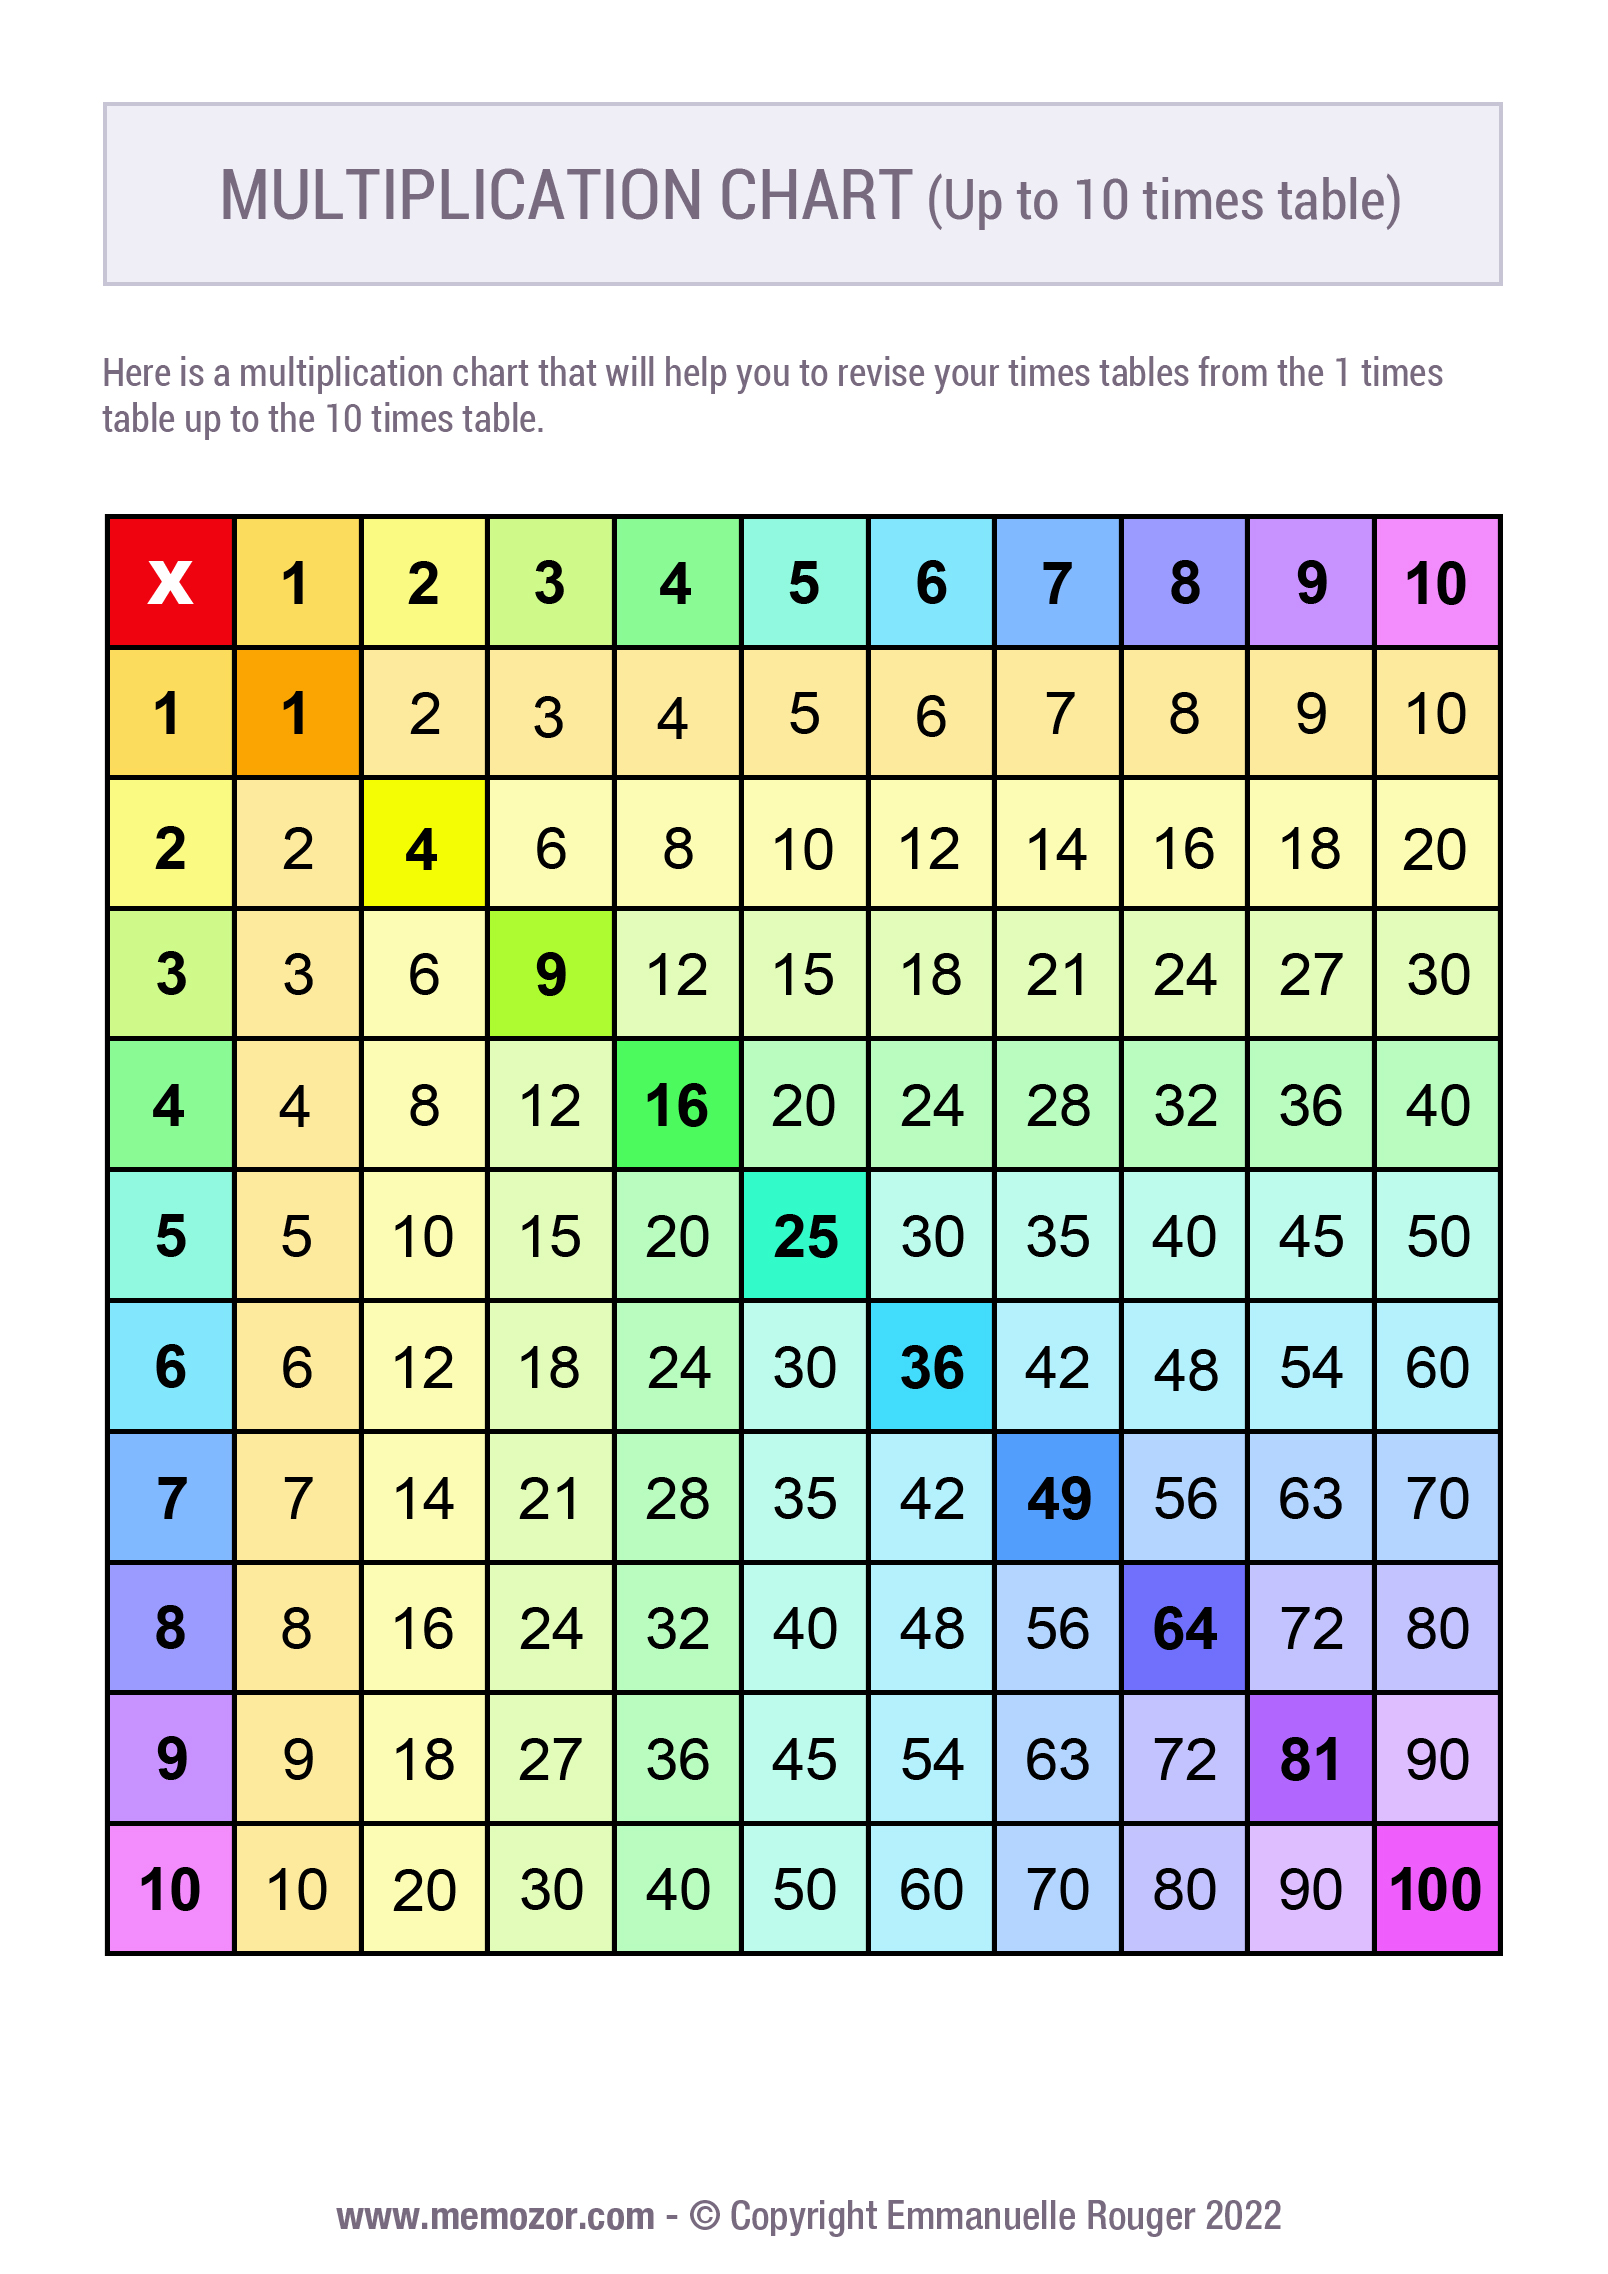
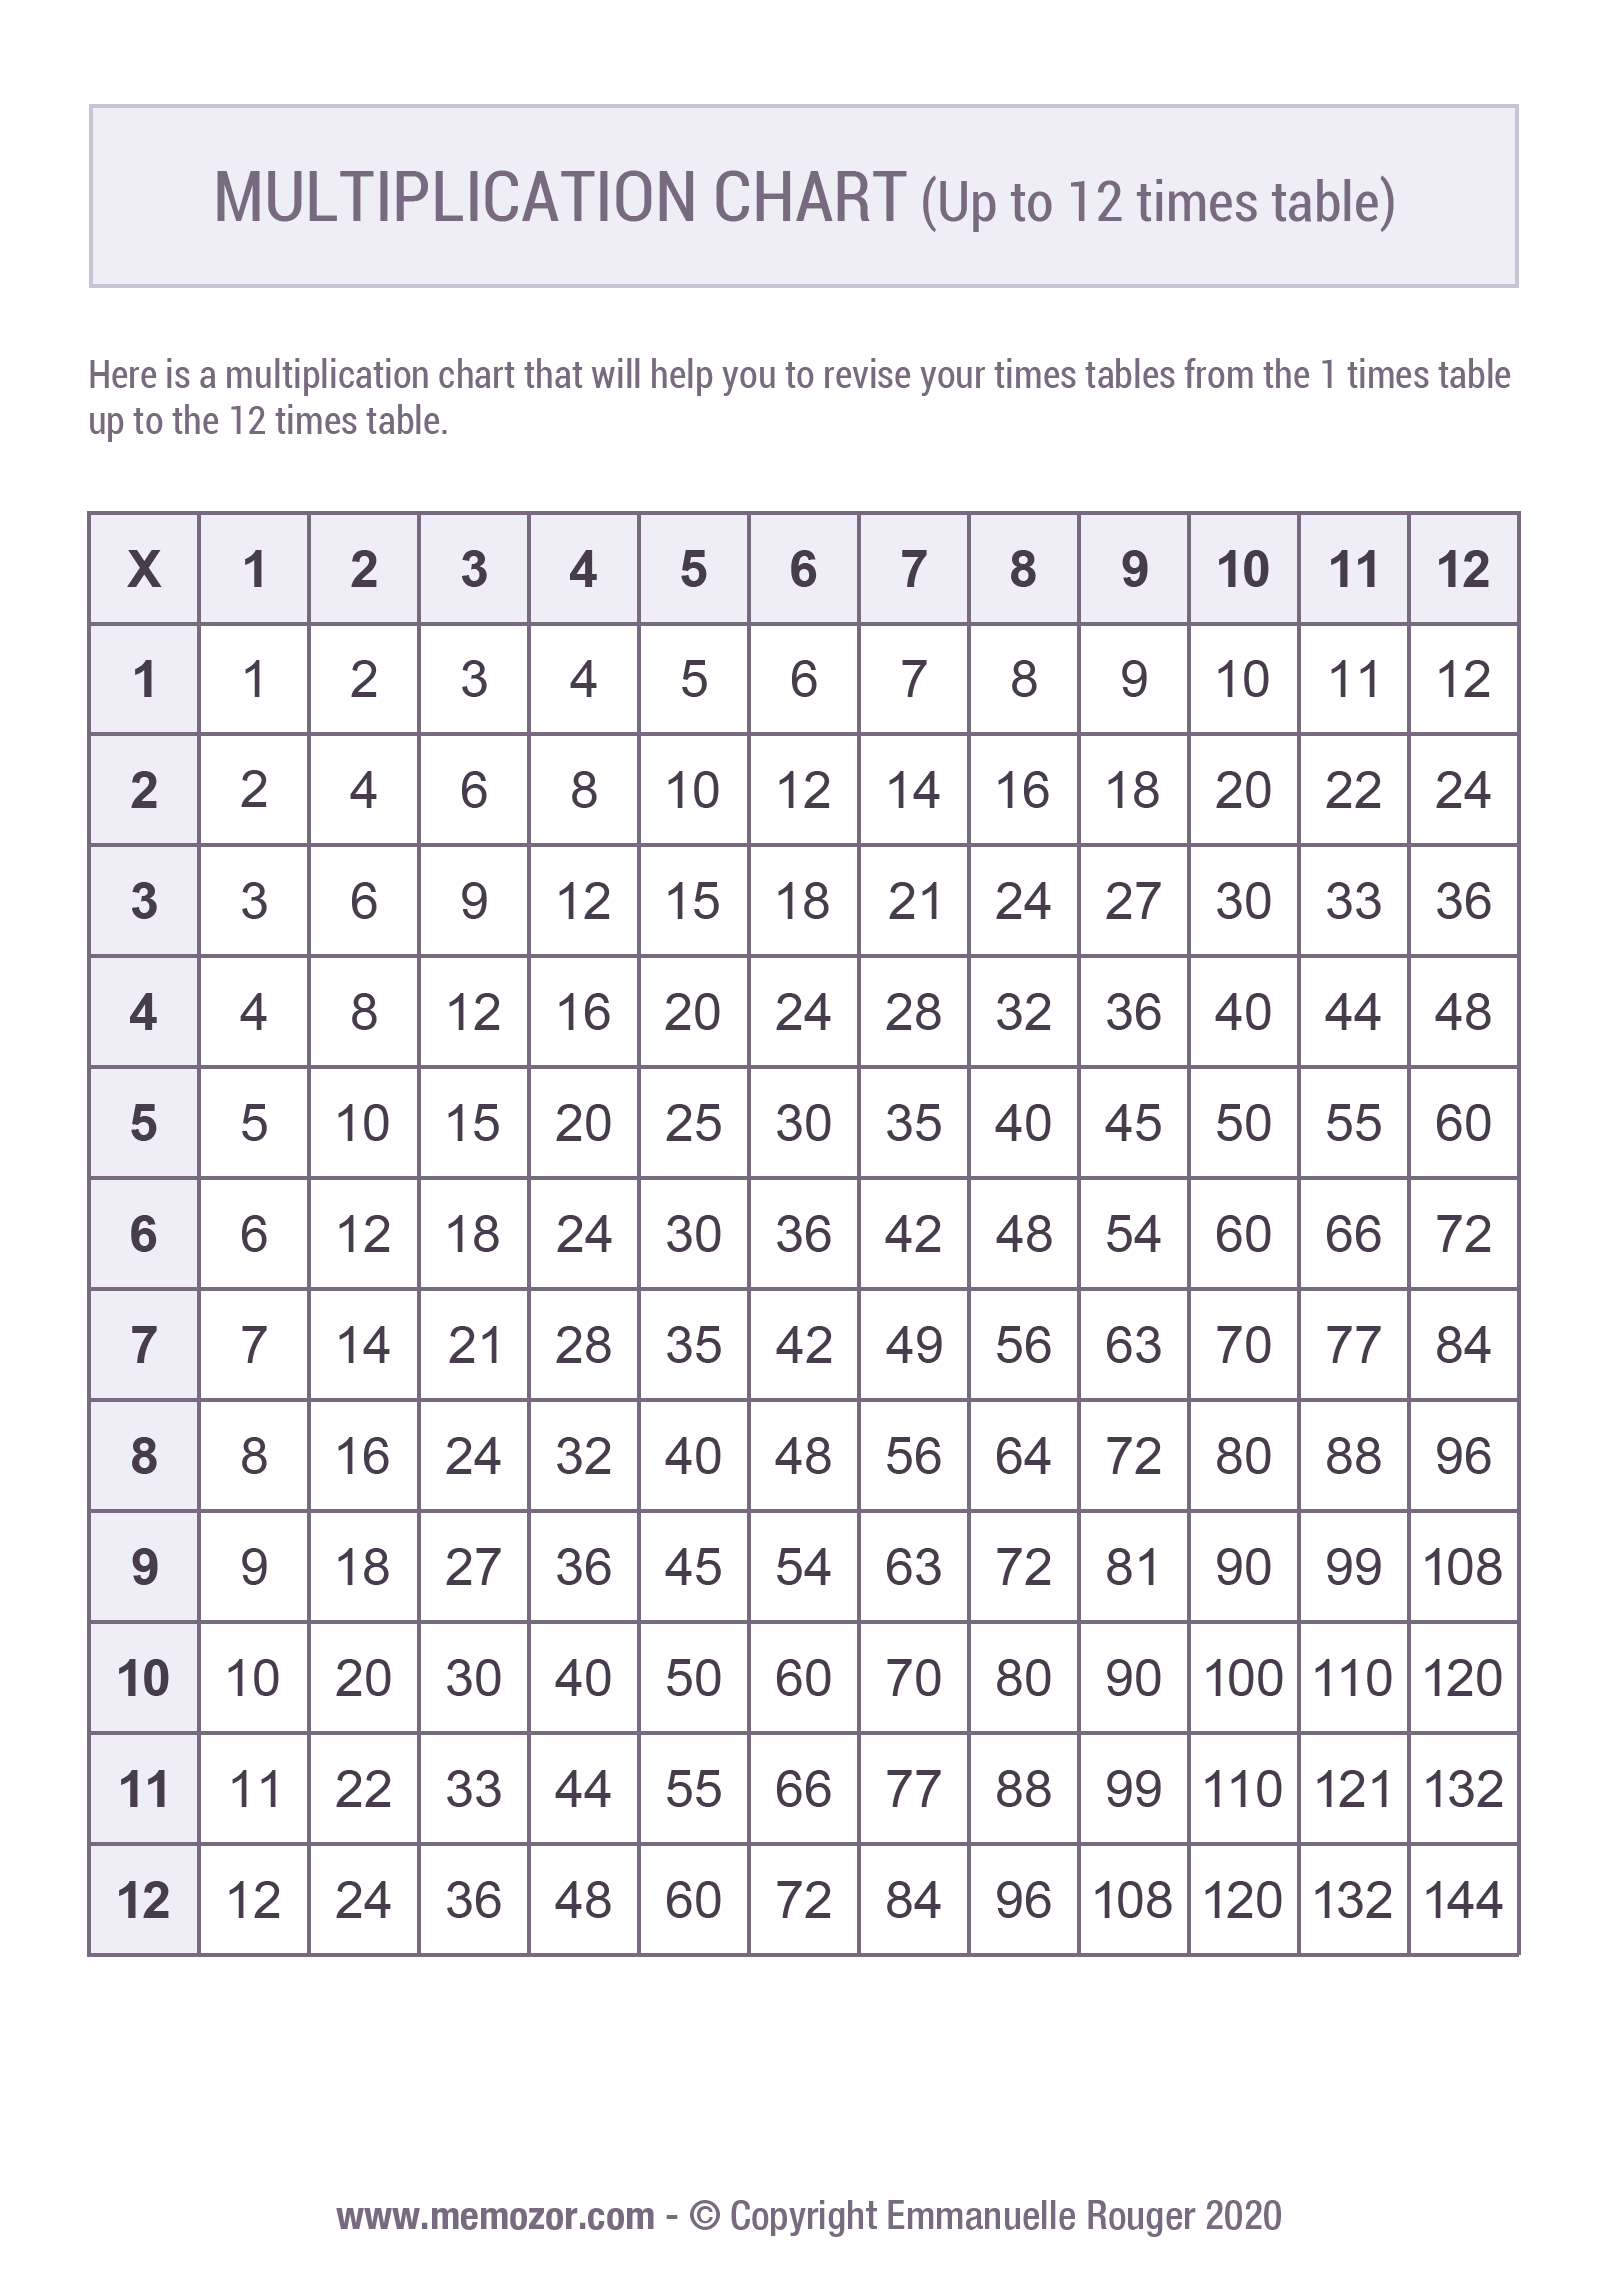
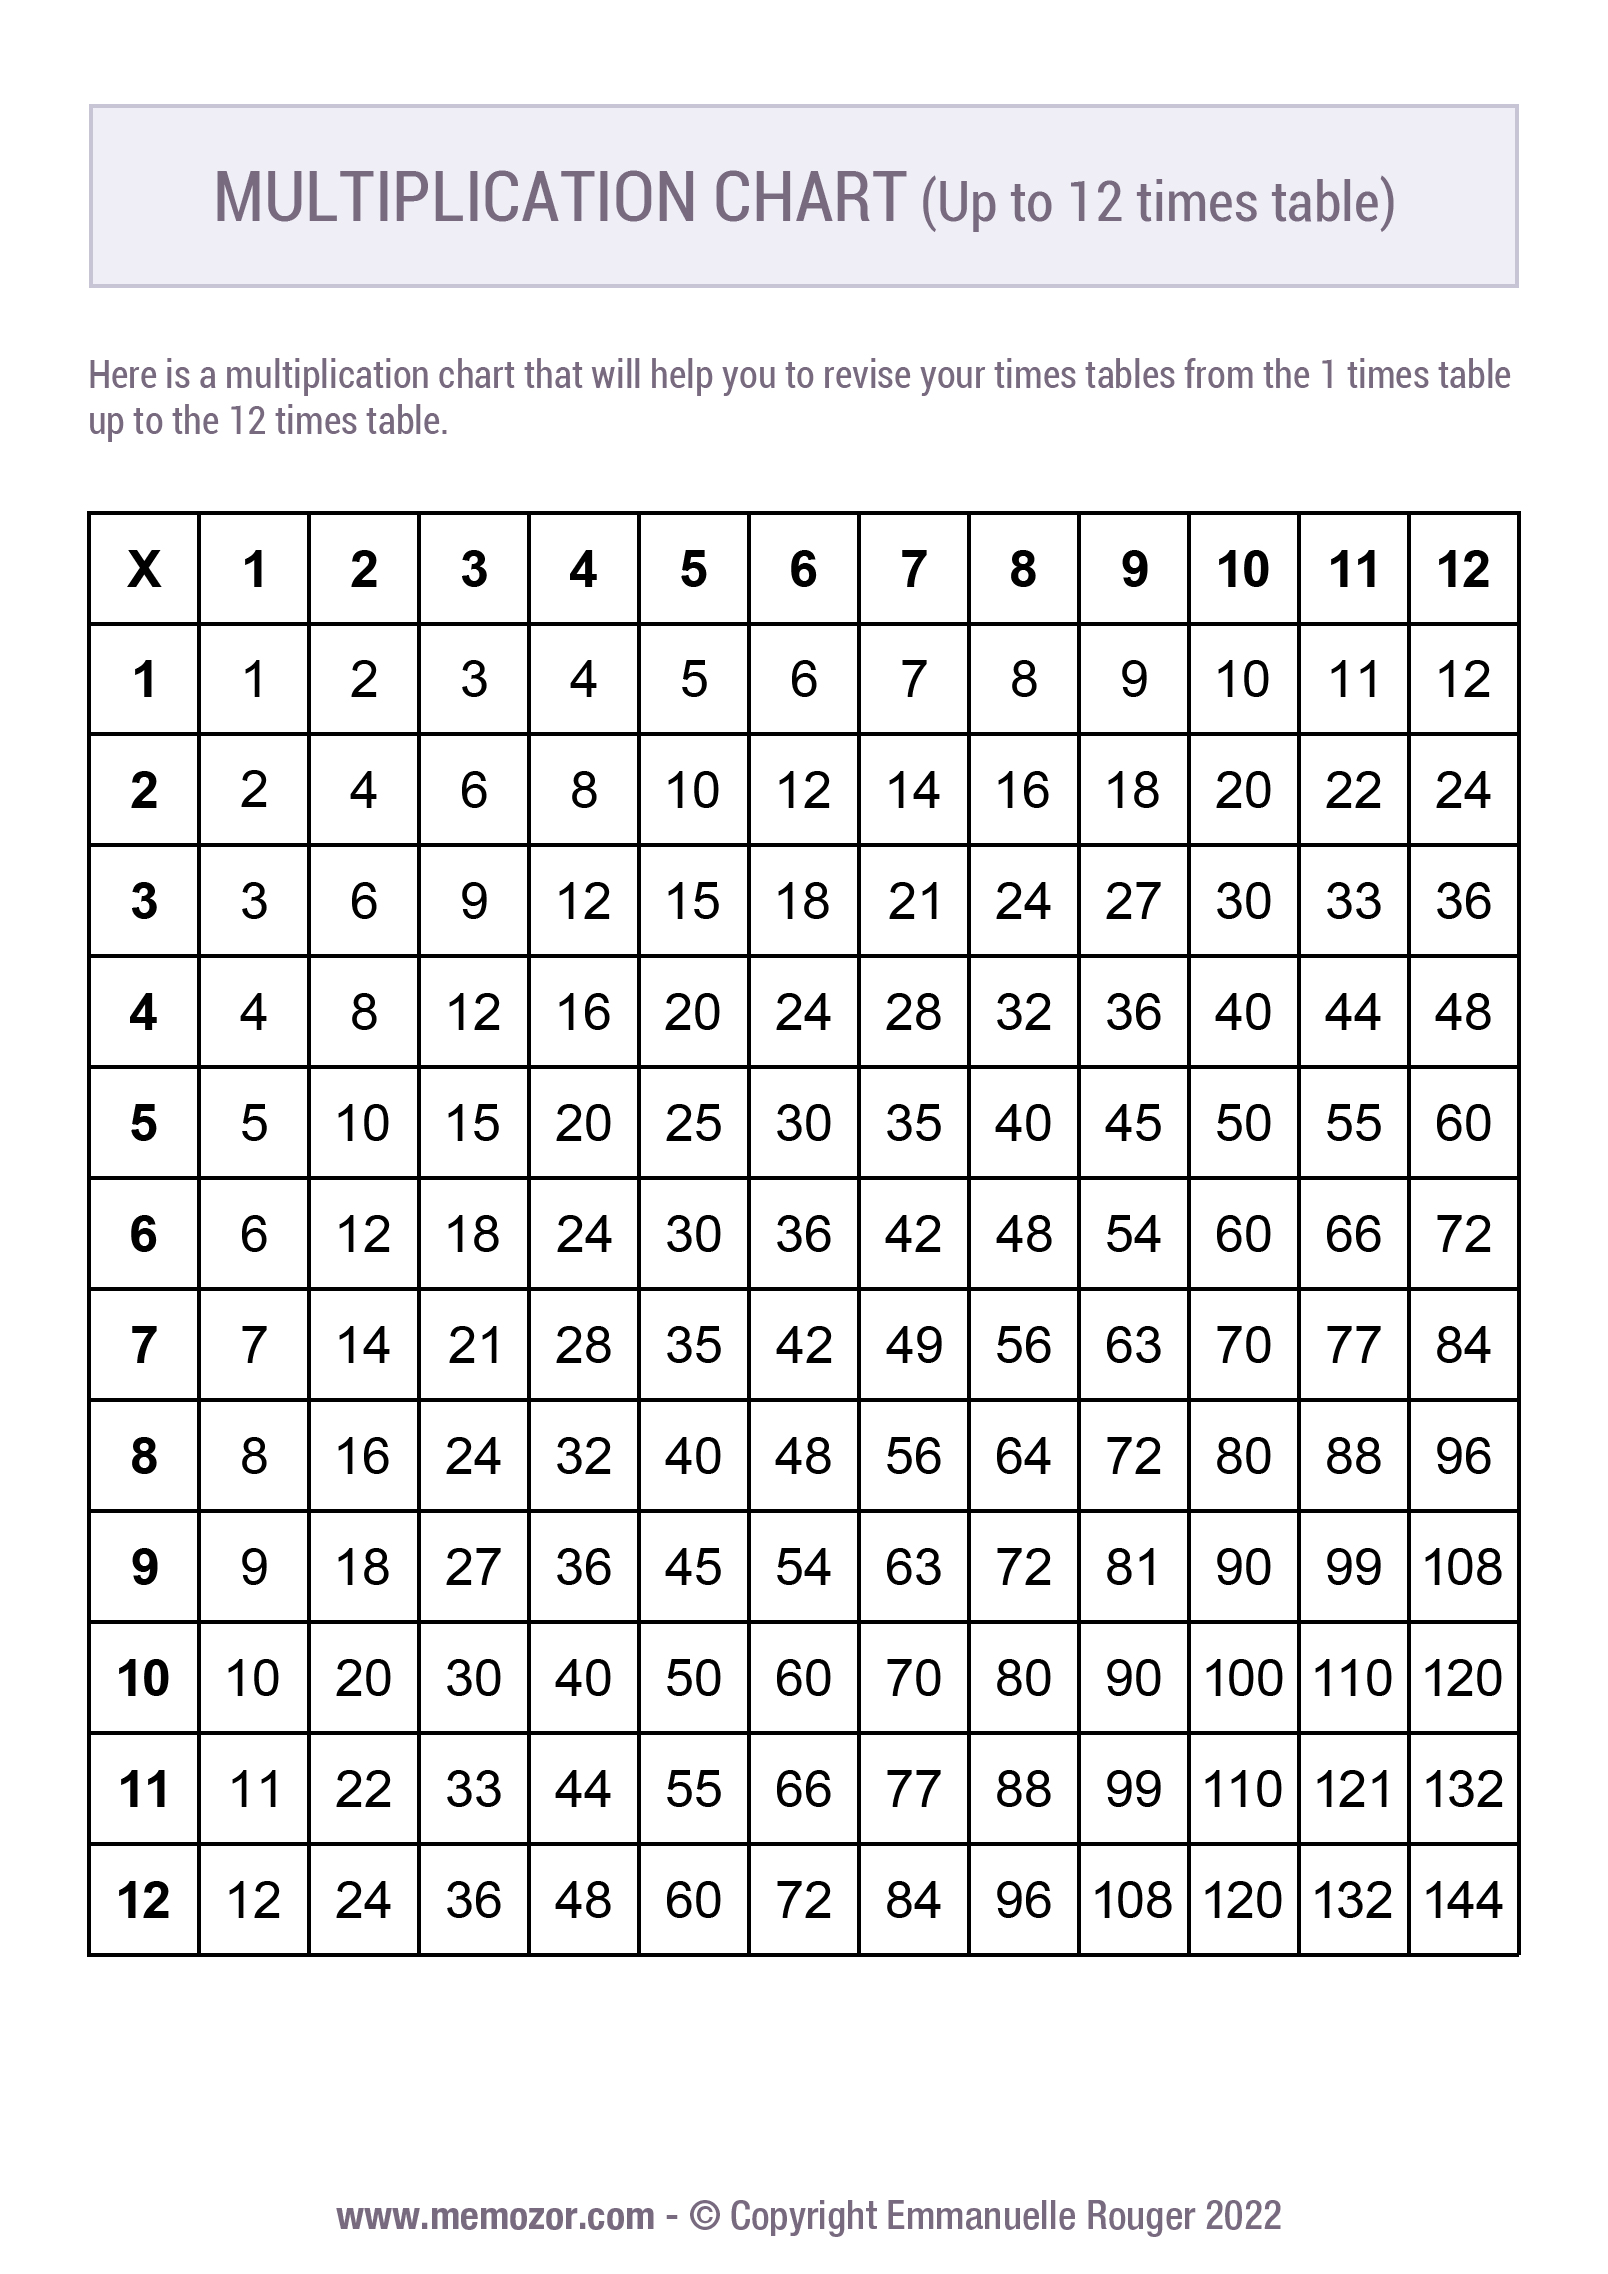
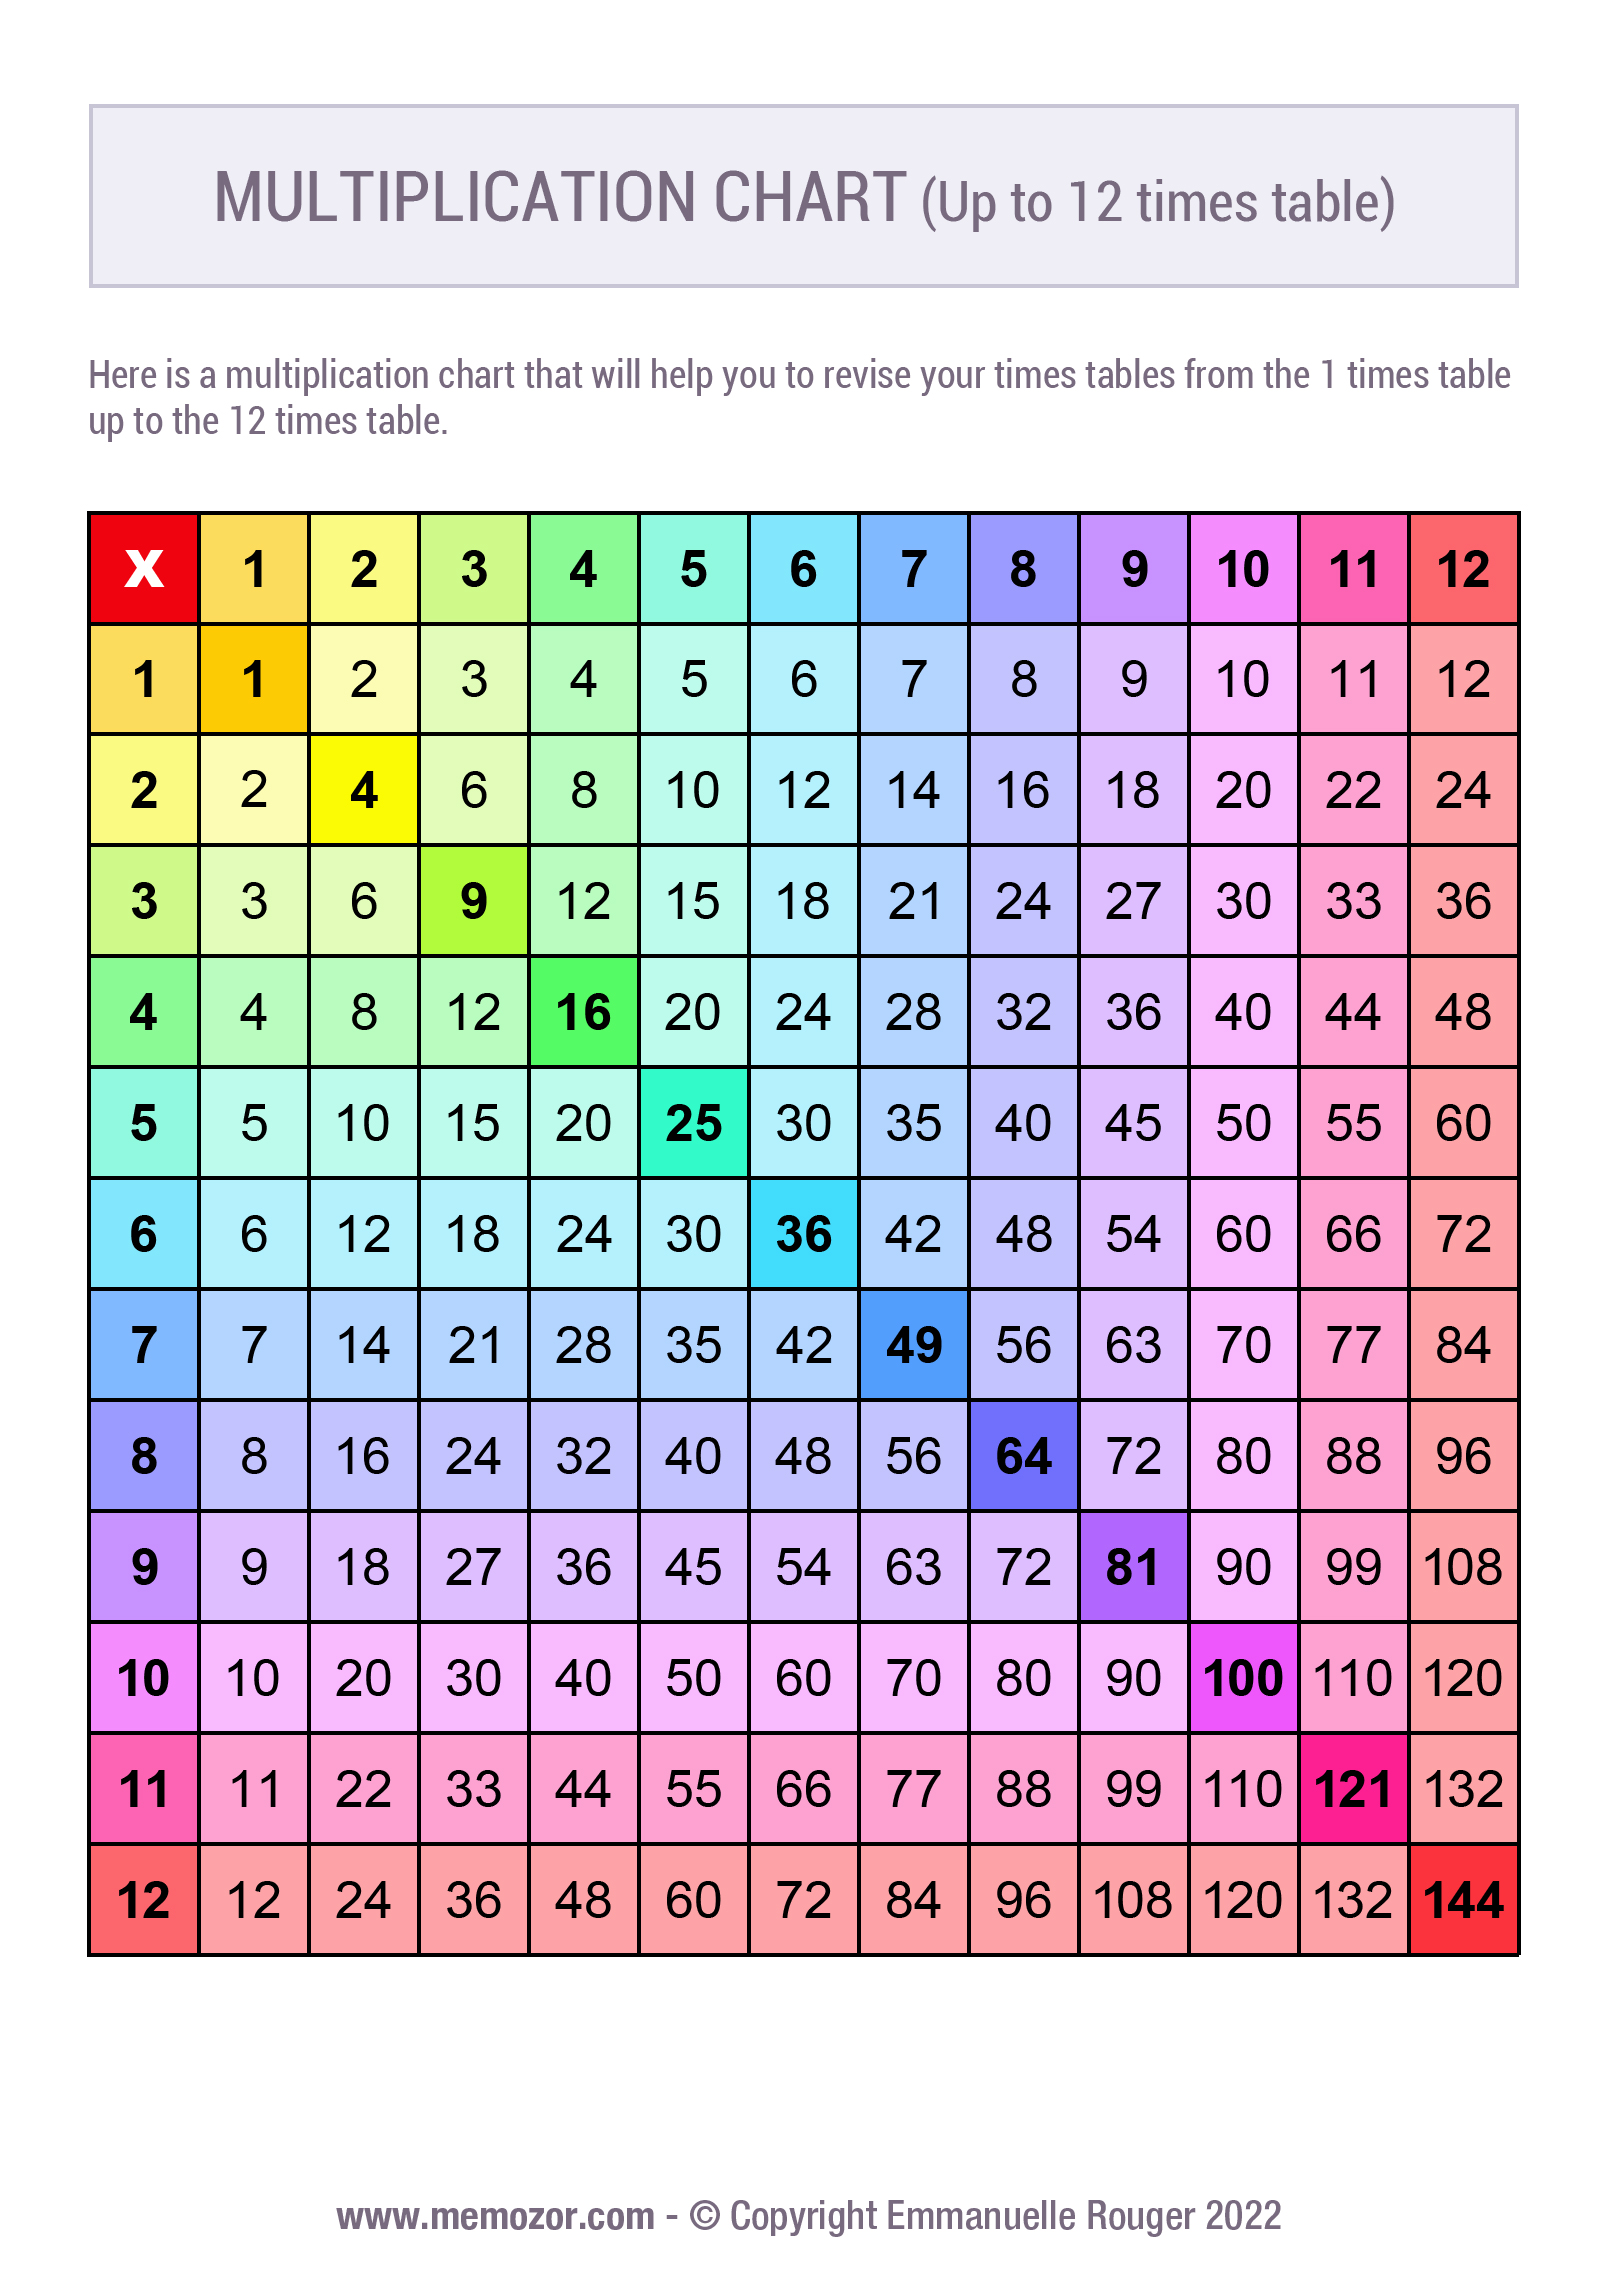
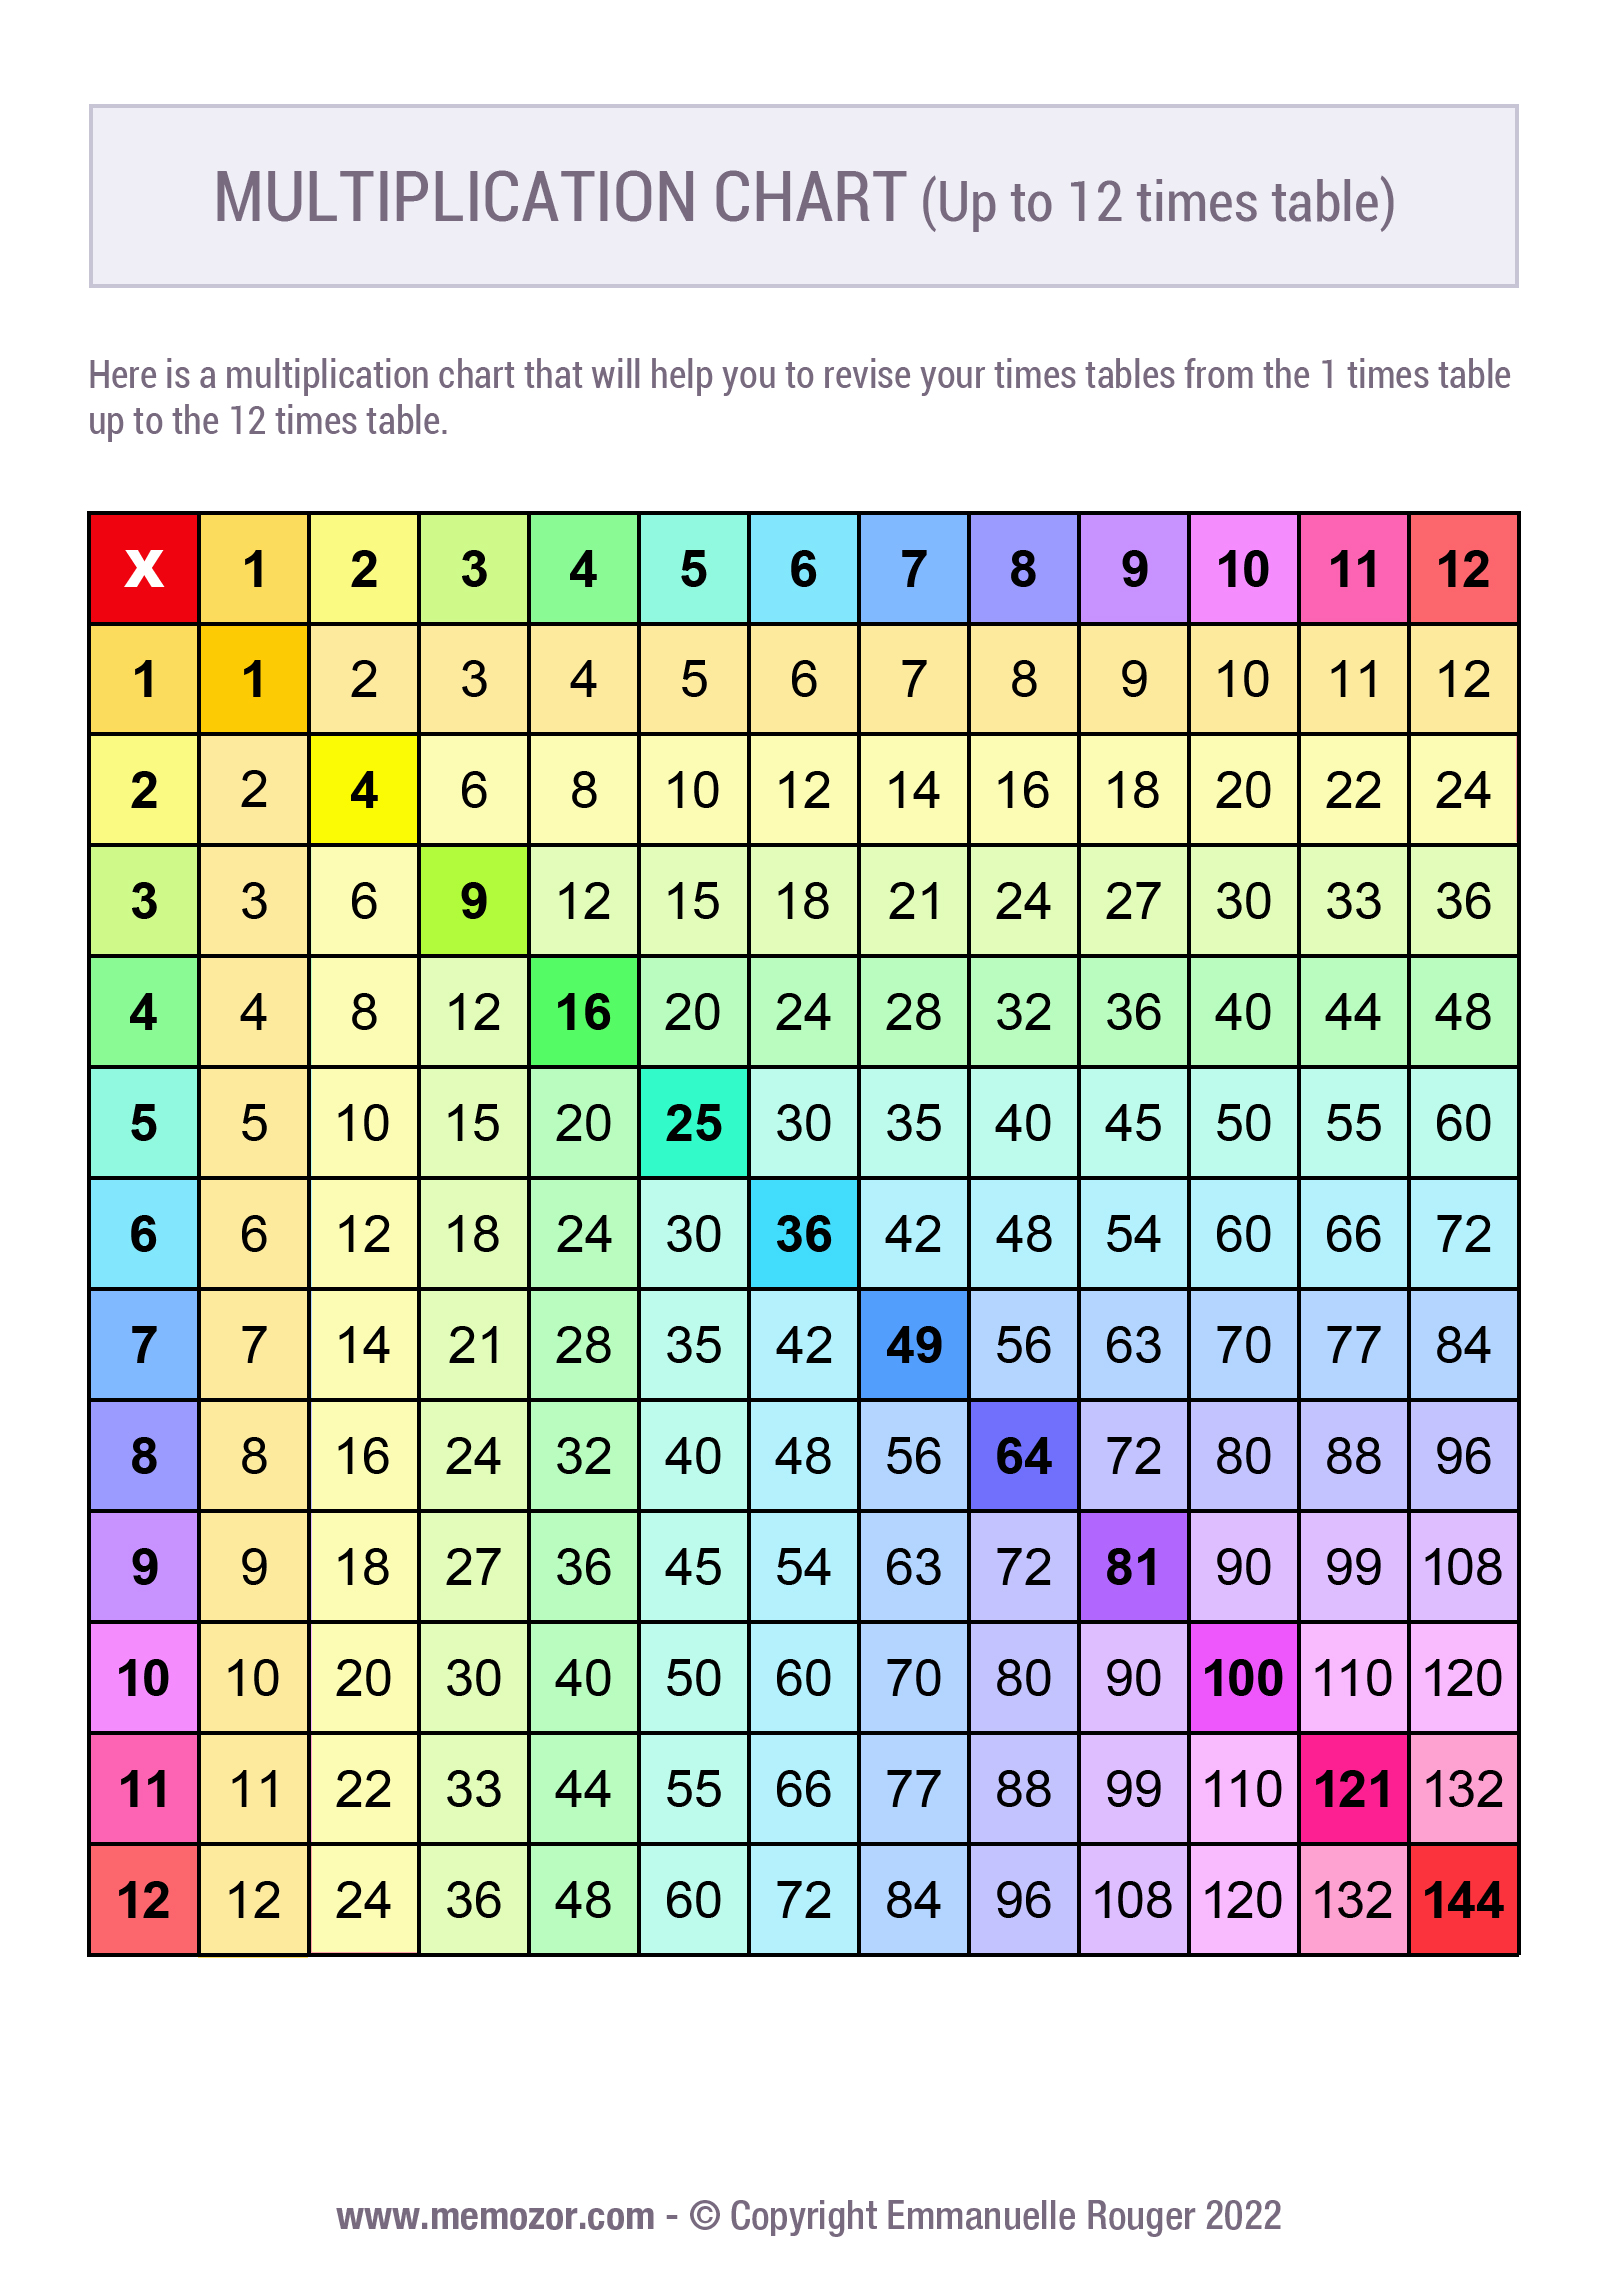
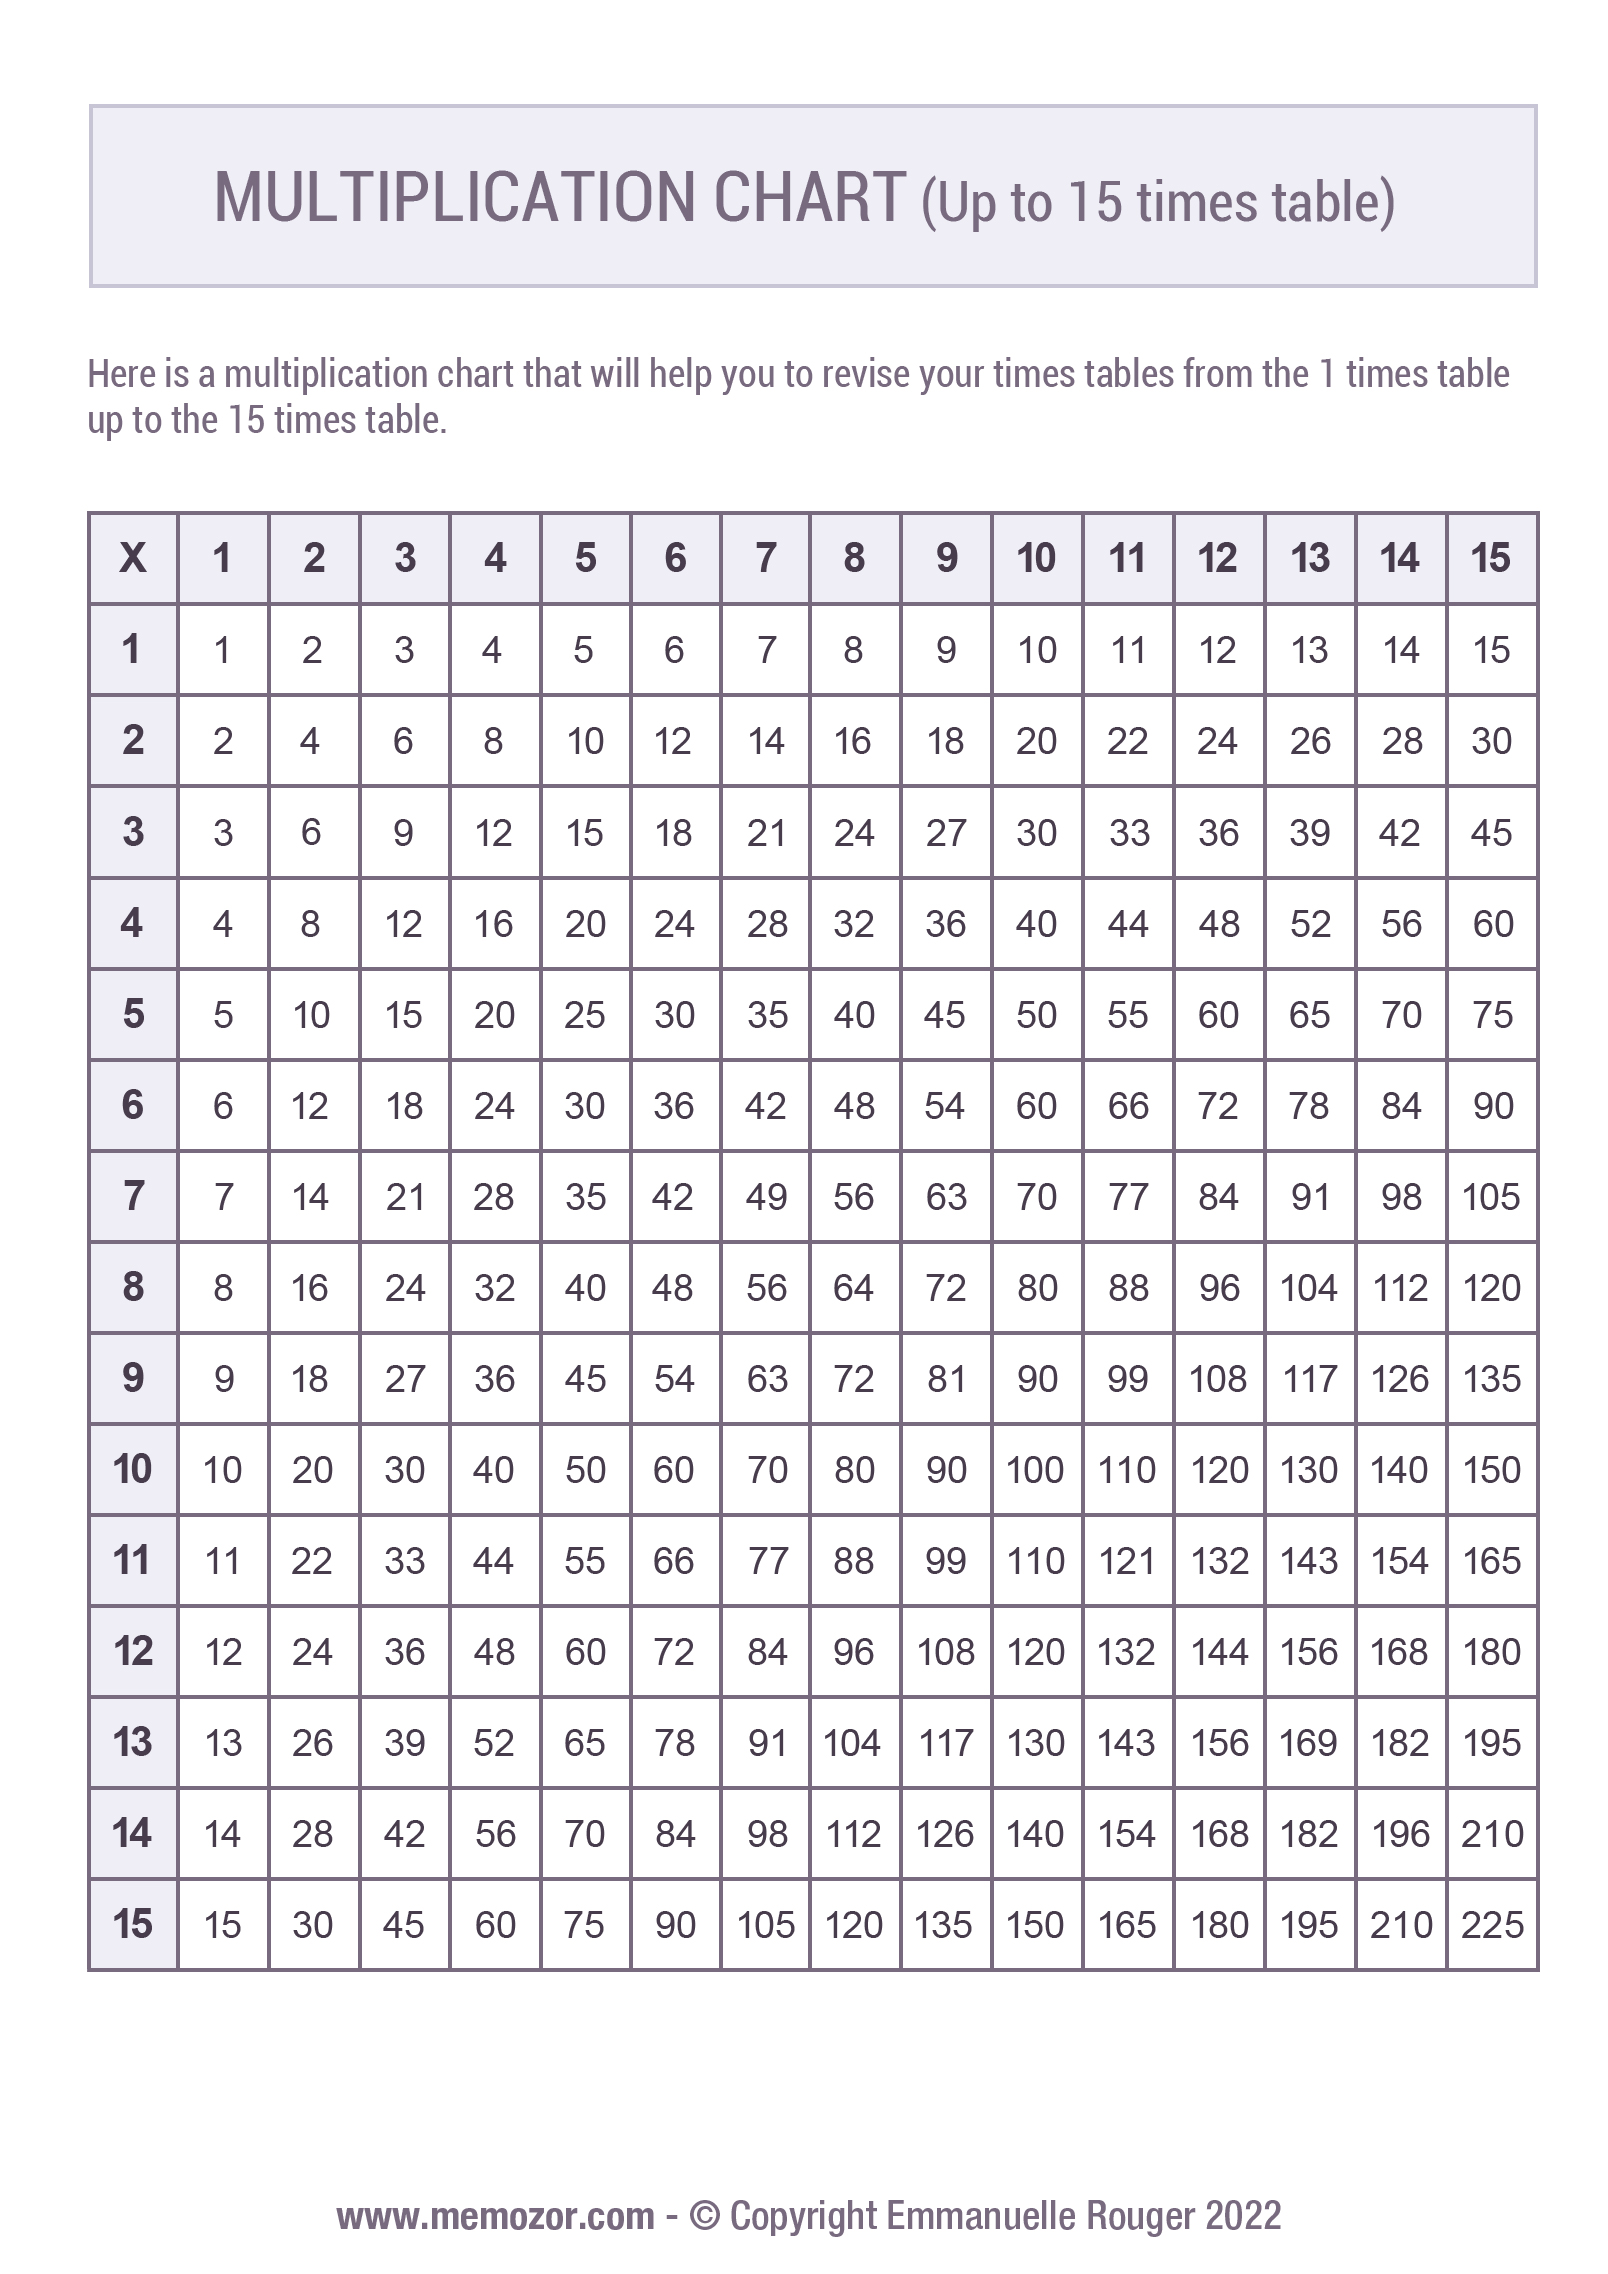
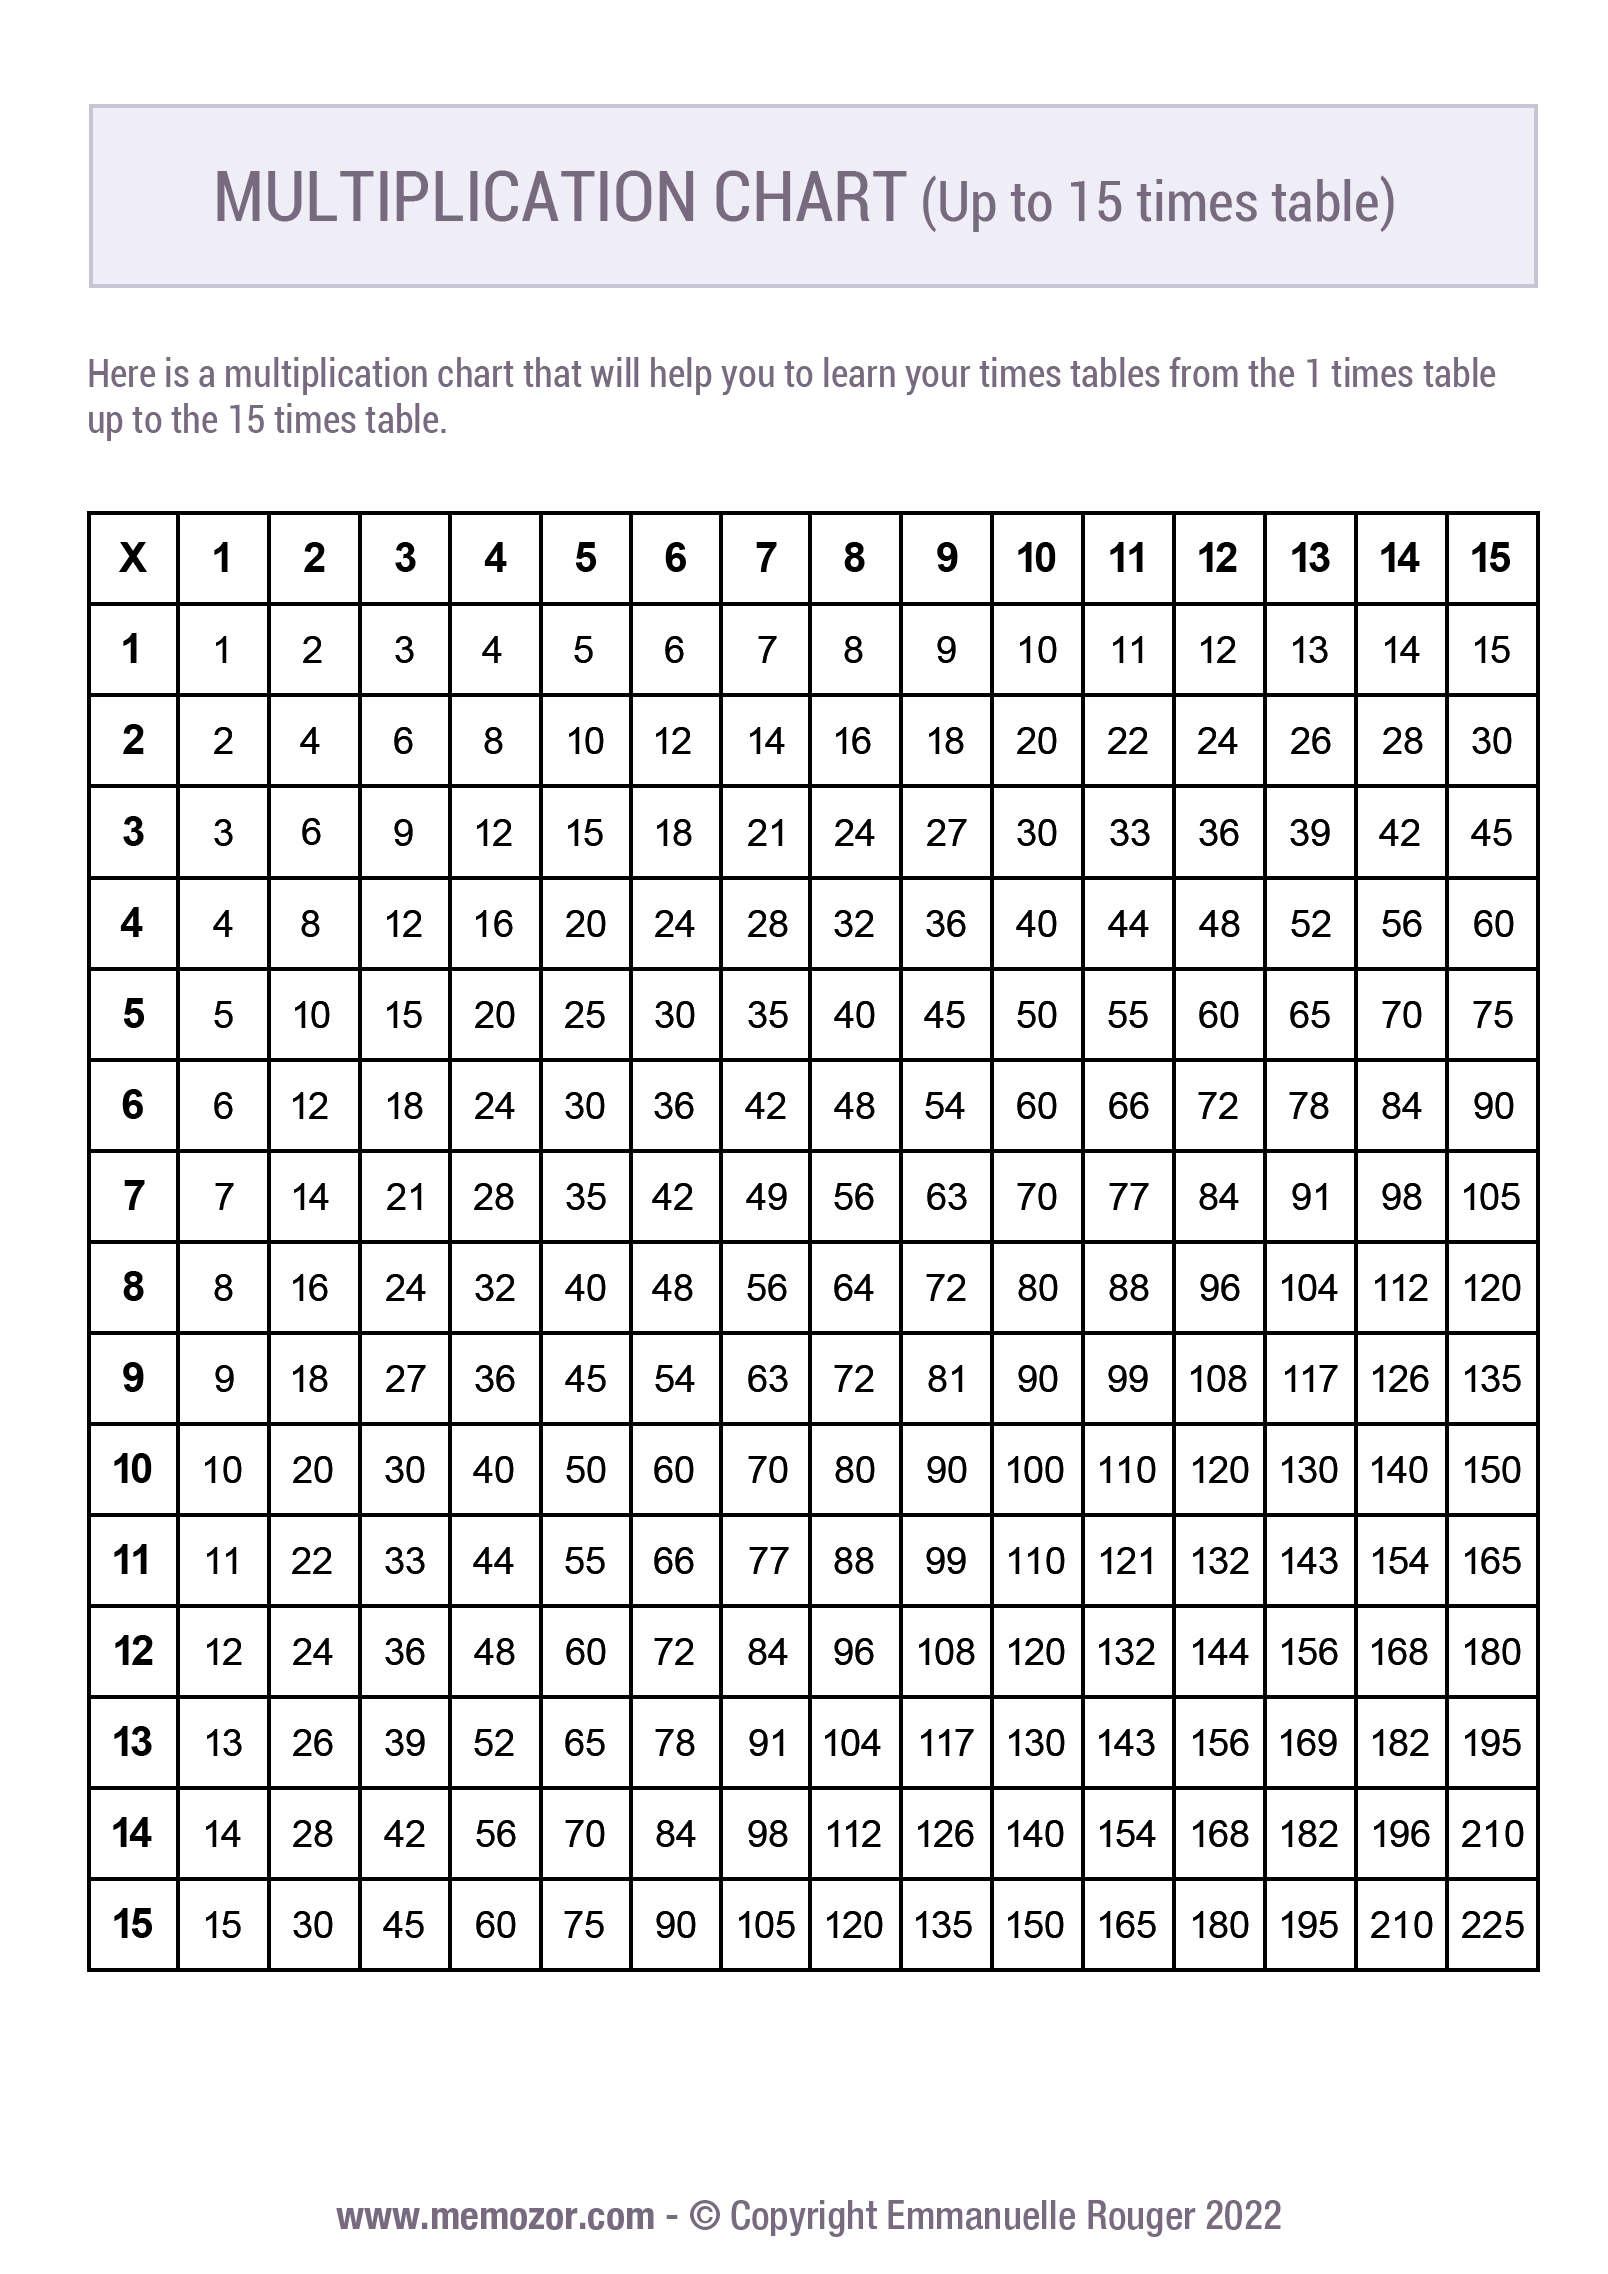
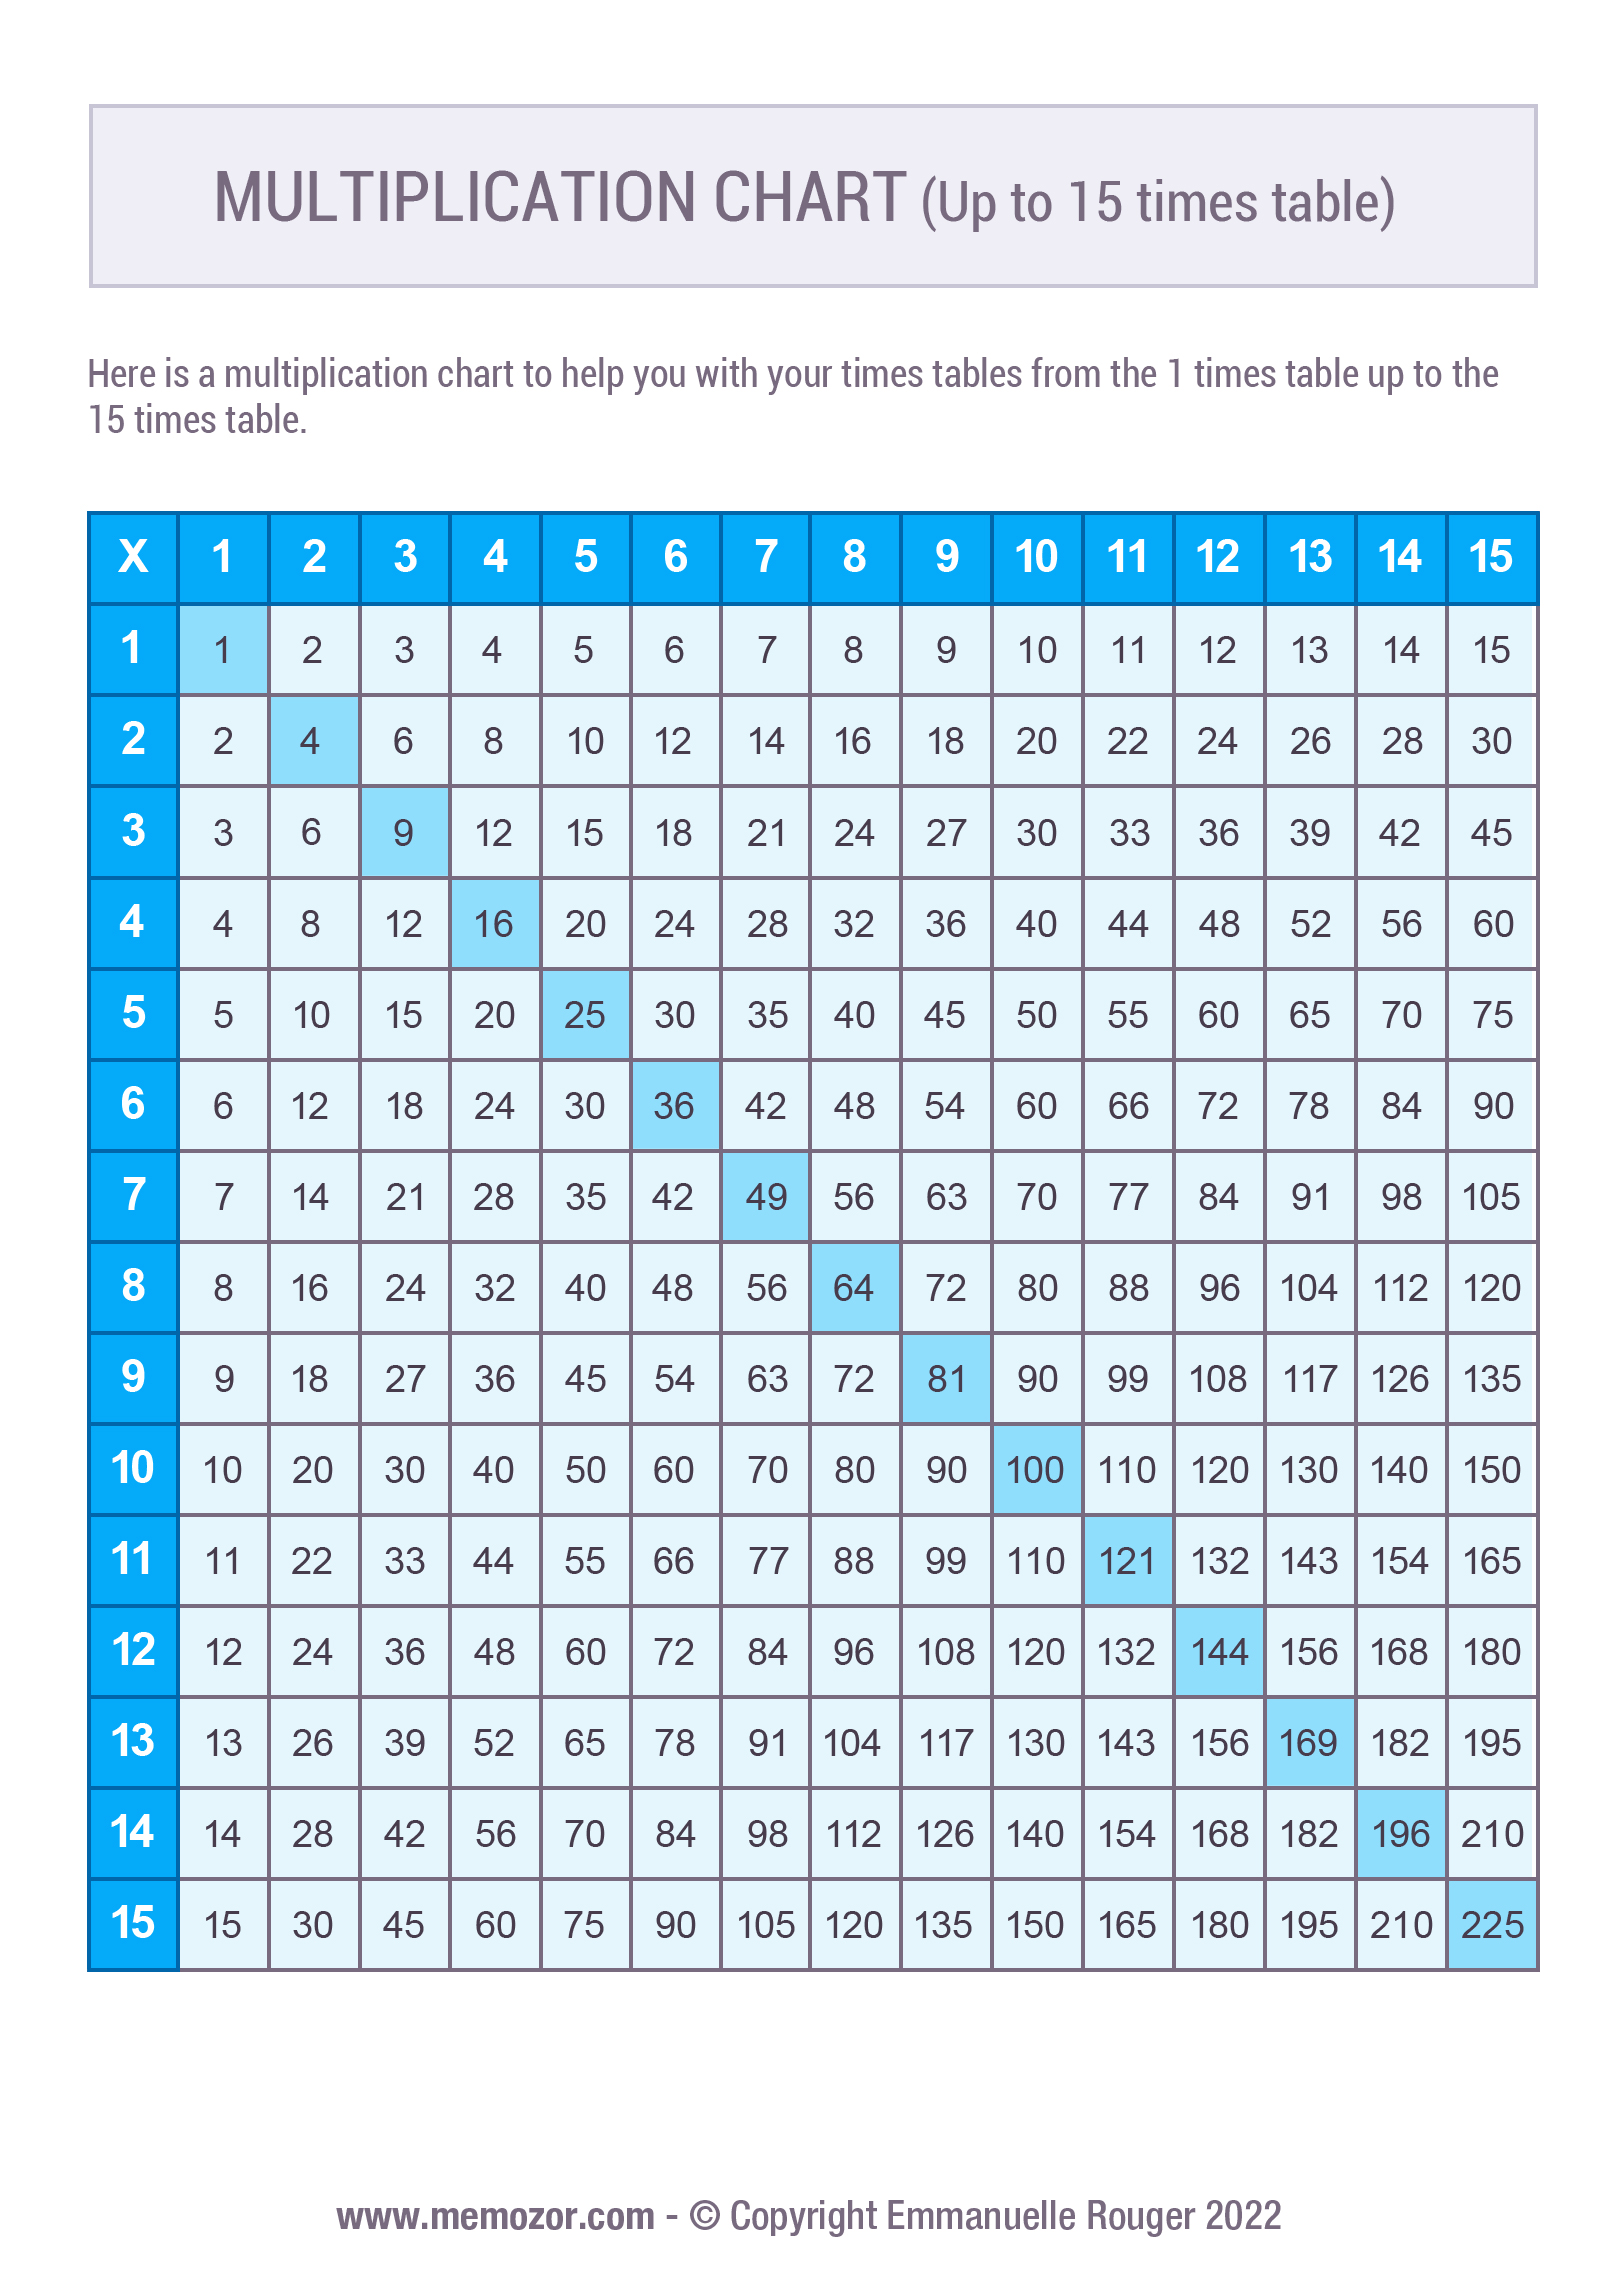
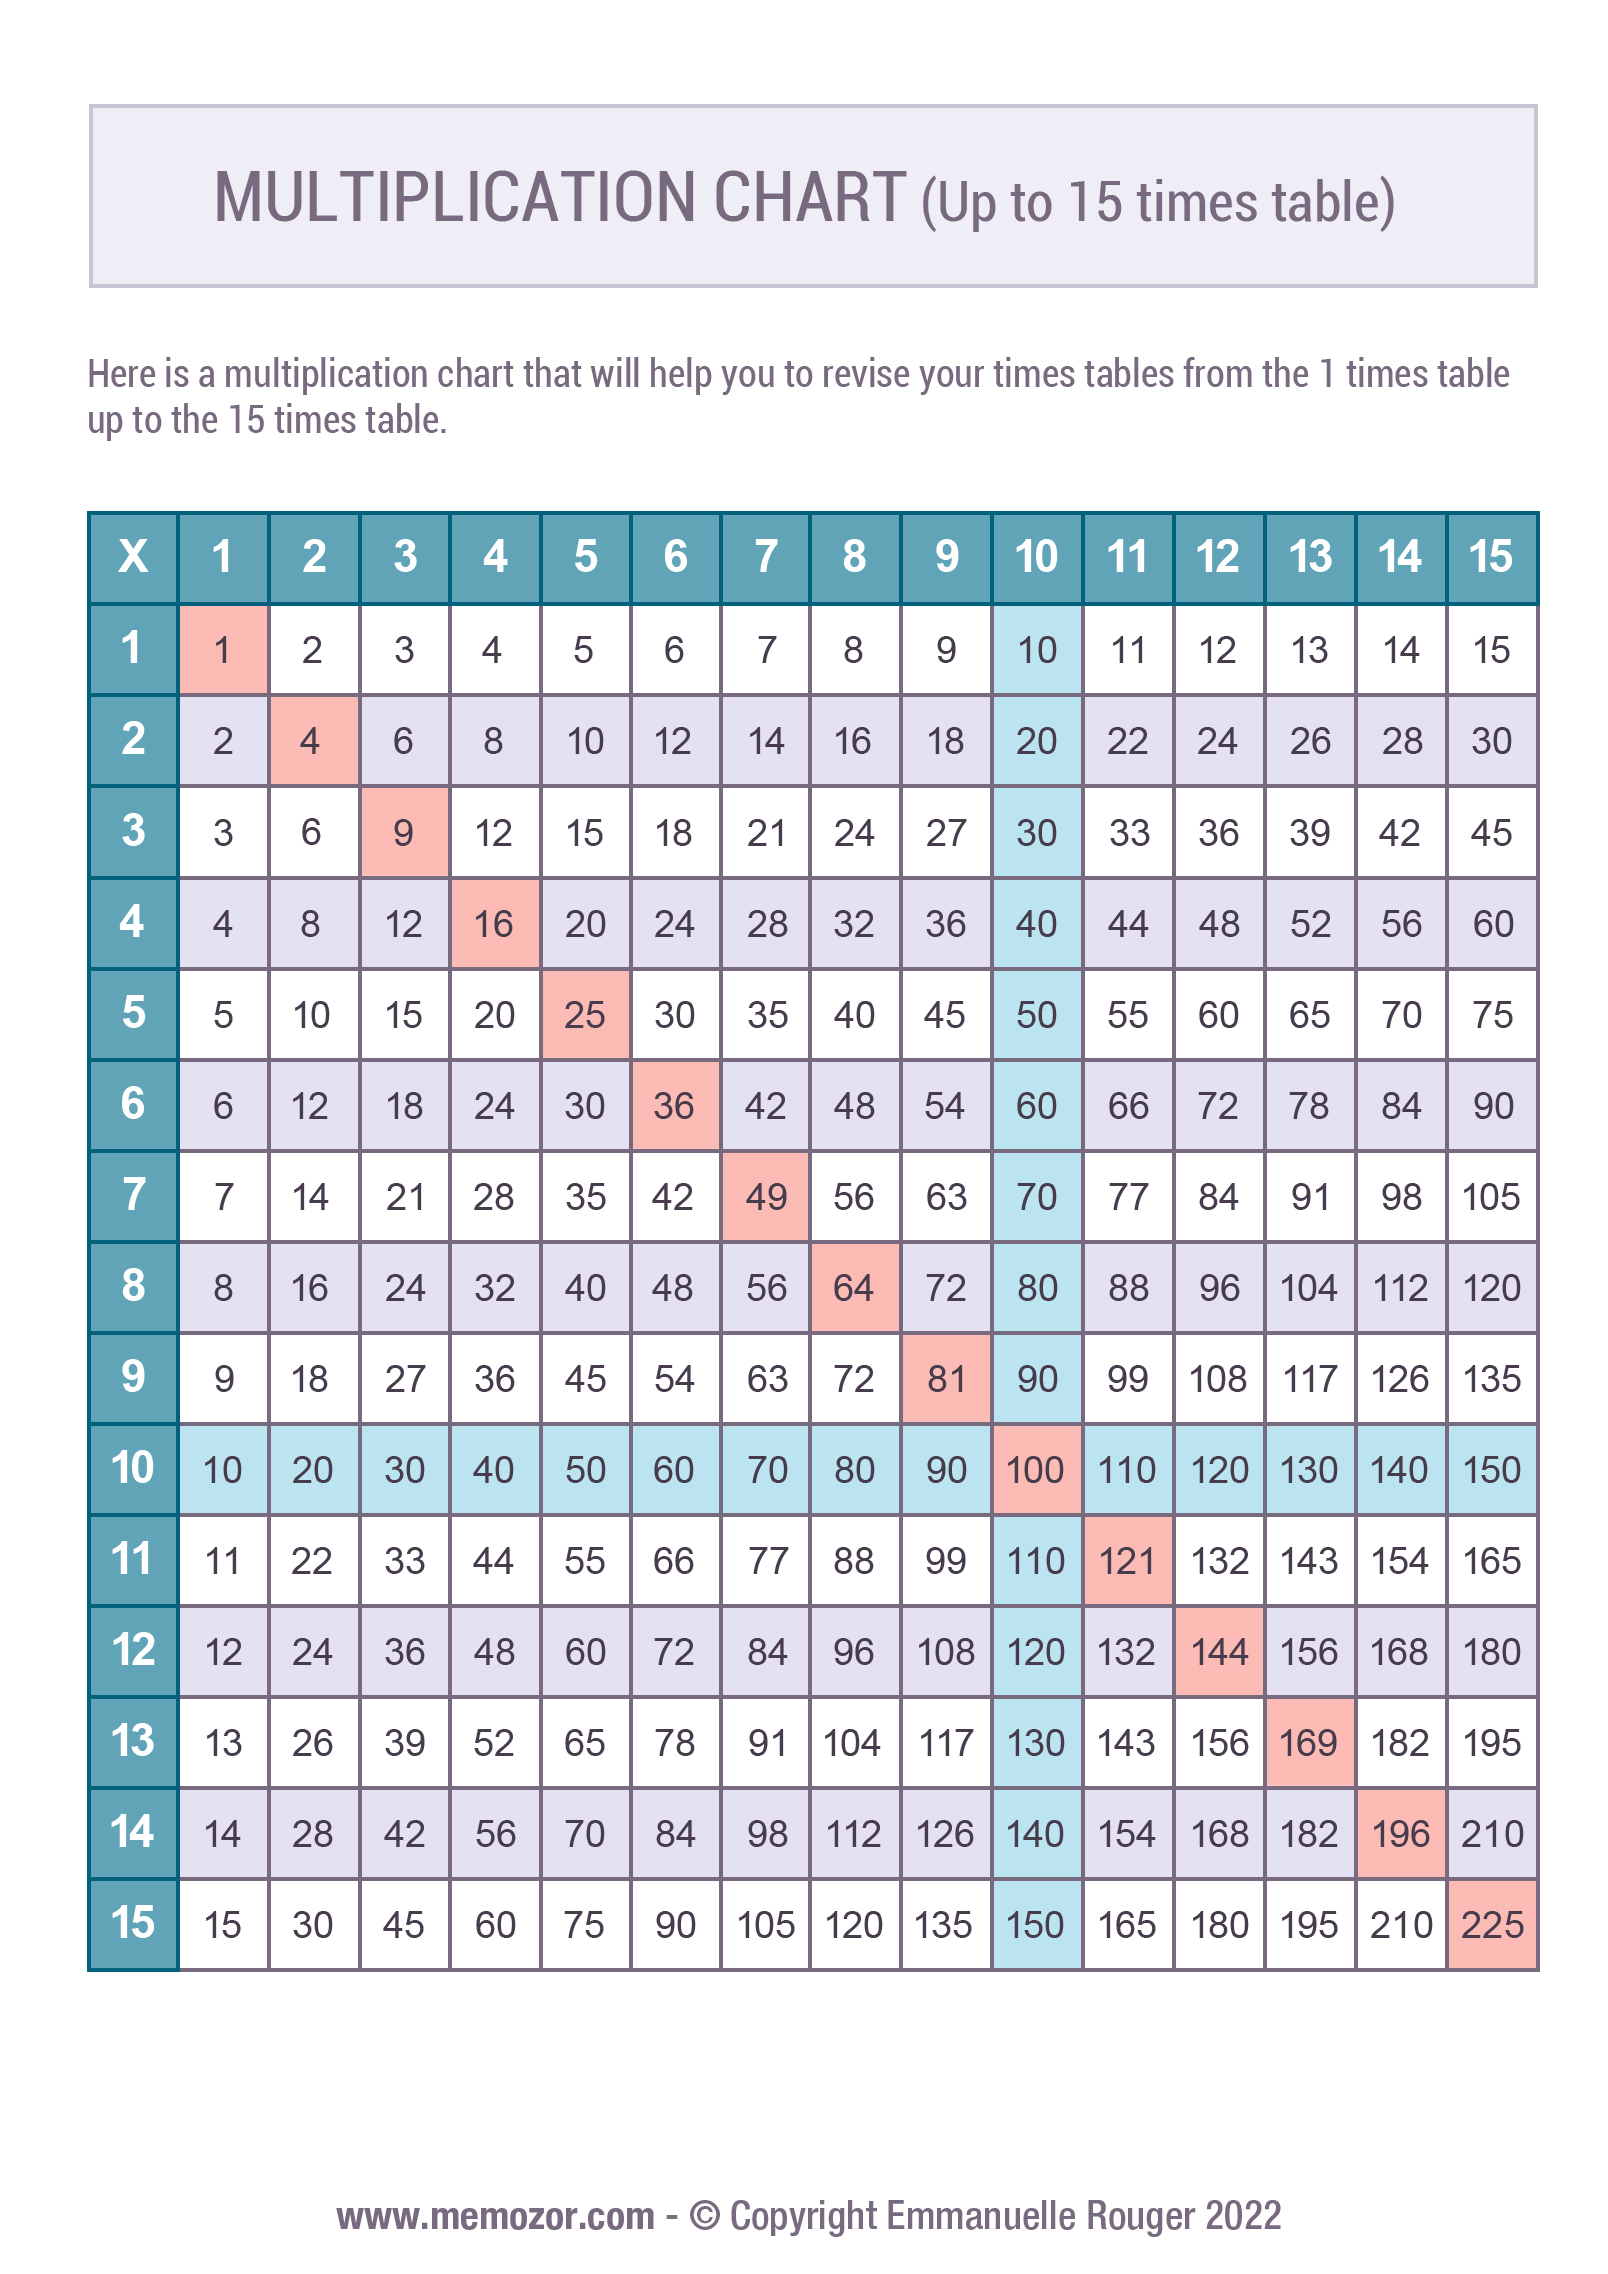
Here's a preview of our free printable multiplication charts, available in PDF format. Whether you're looking for a 10×10 or 12×12 chart, colorful or black and white, filled in or blank, you're sure to find the one that suits your needs. Click "View all charts" under each selection to discover every chart available in that category.
Multiplication charts 1-10
Multiplication charts 1-12
Multiplication charts 1-15
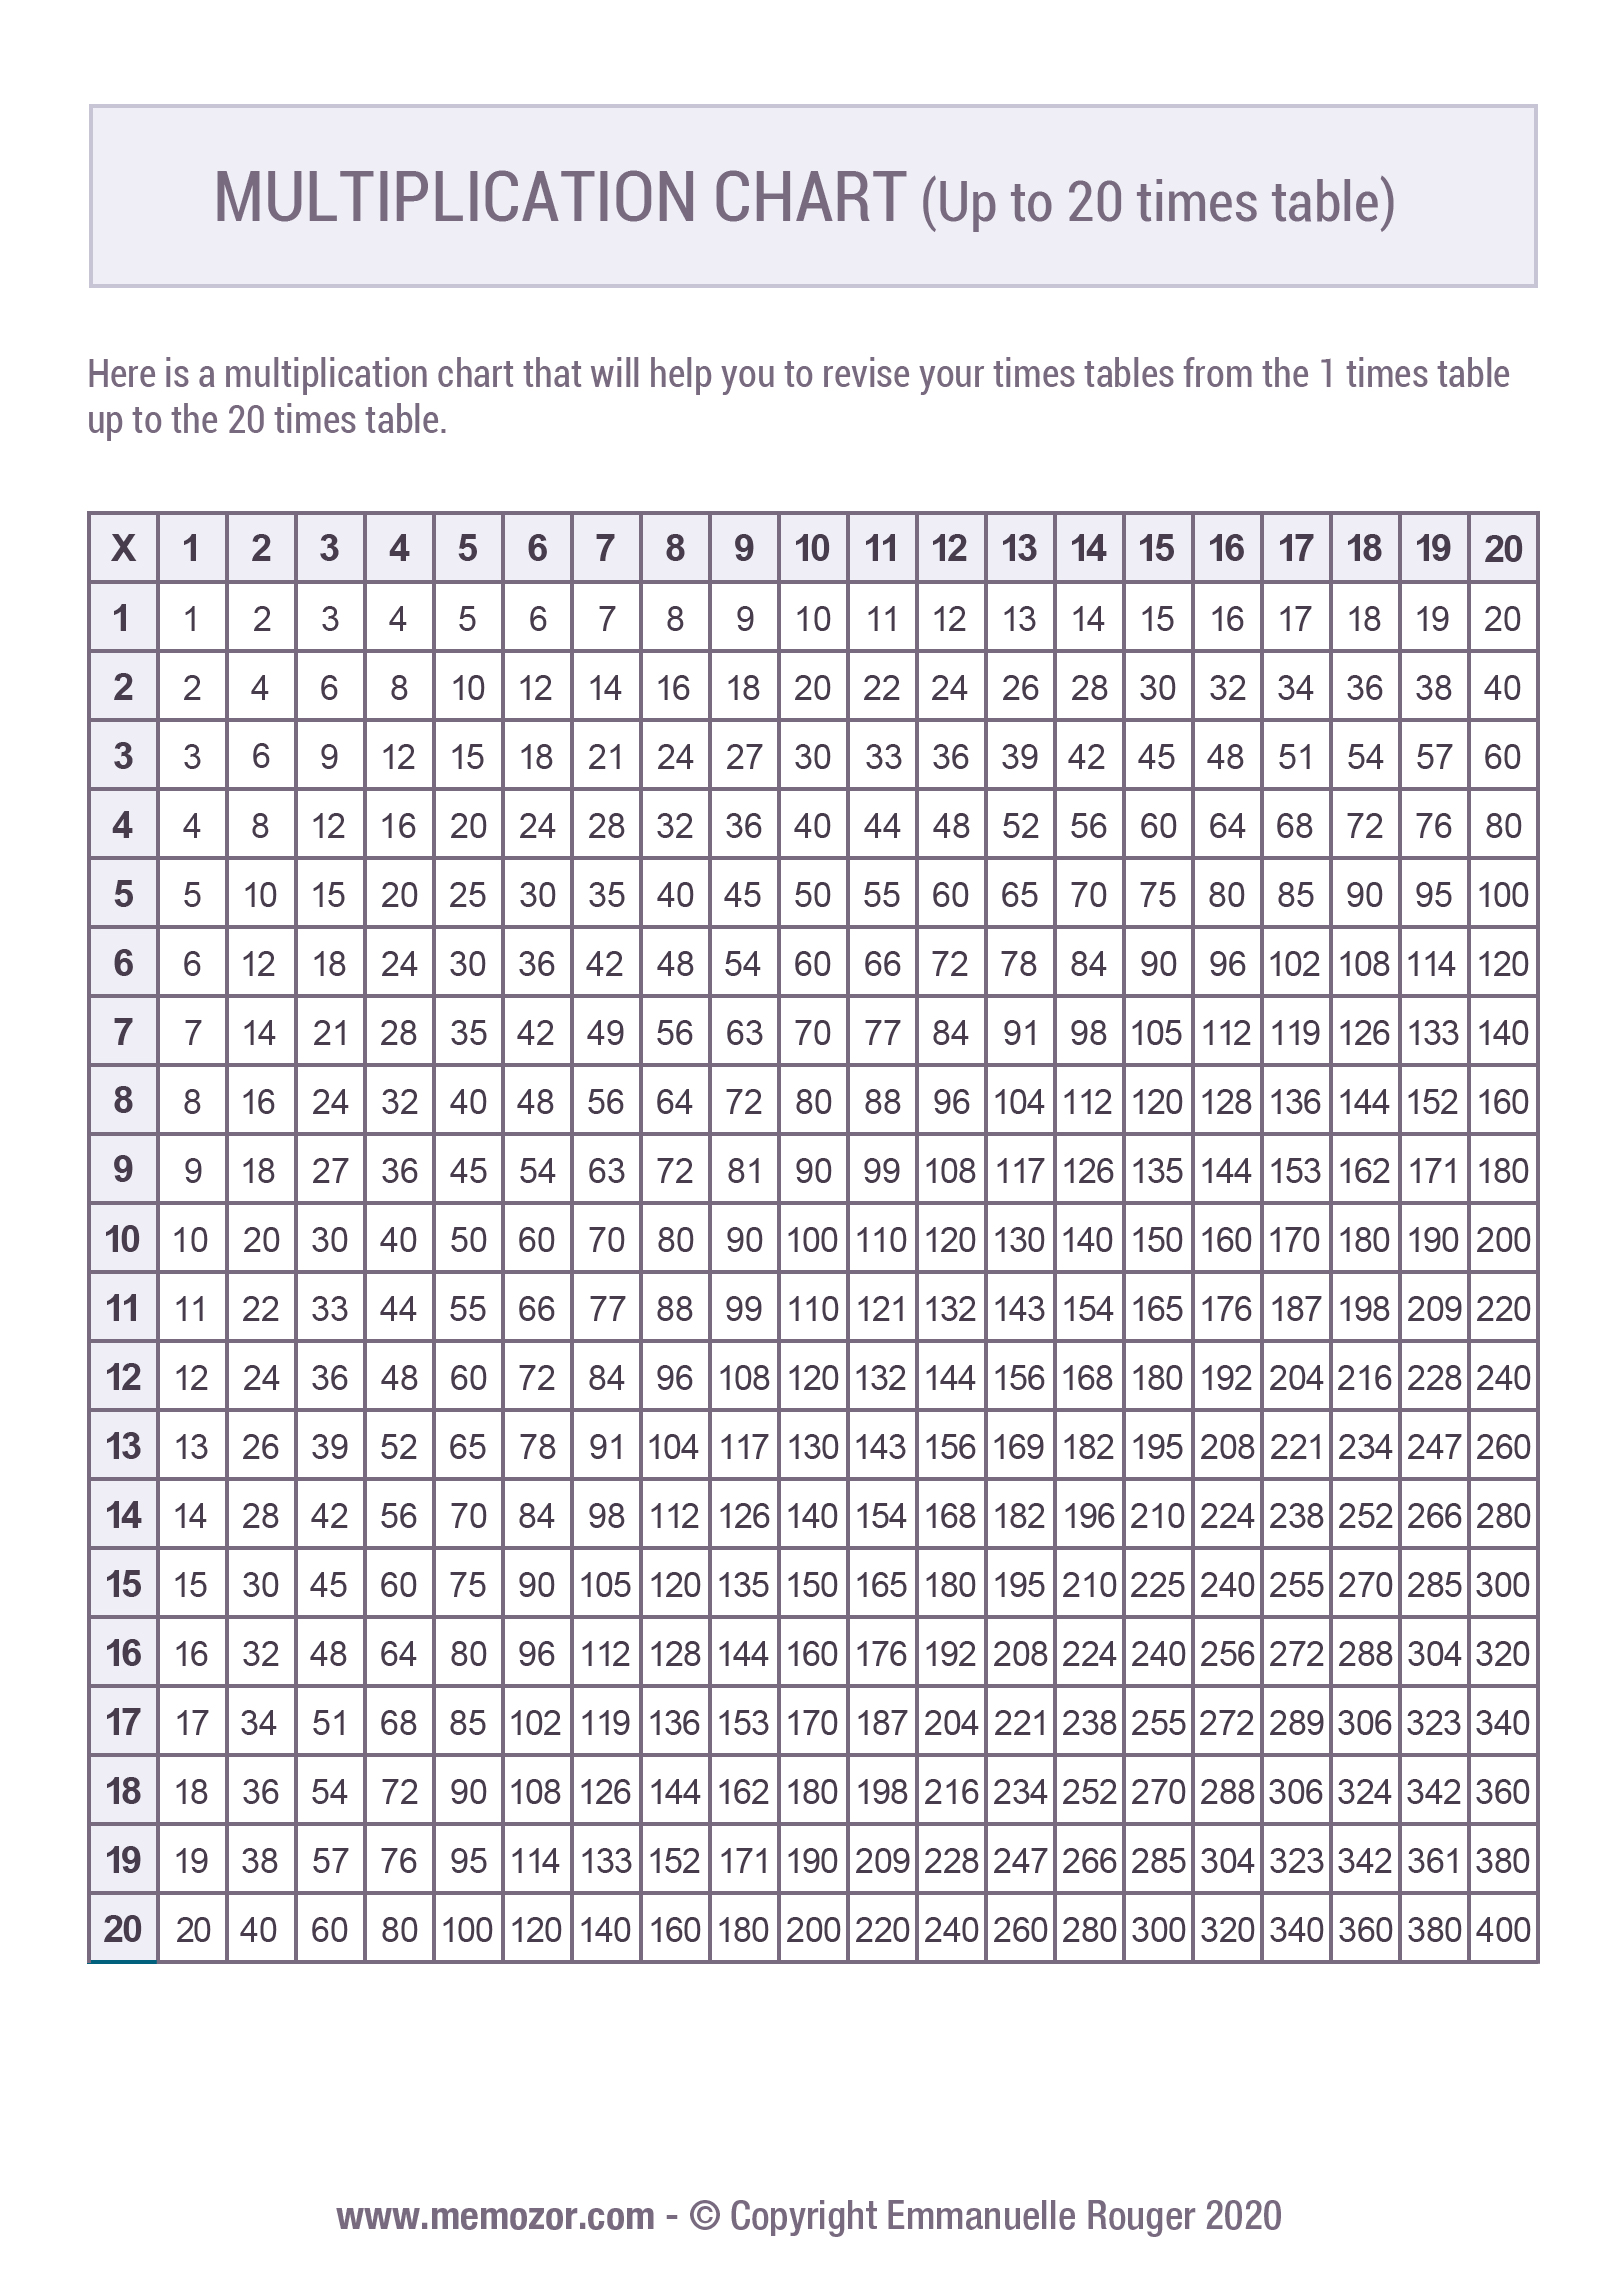
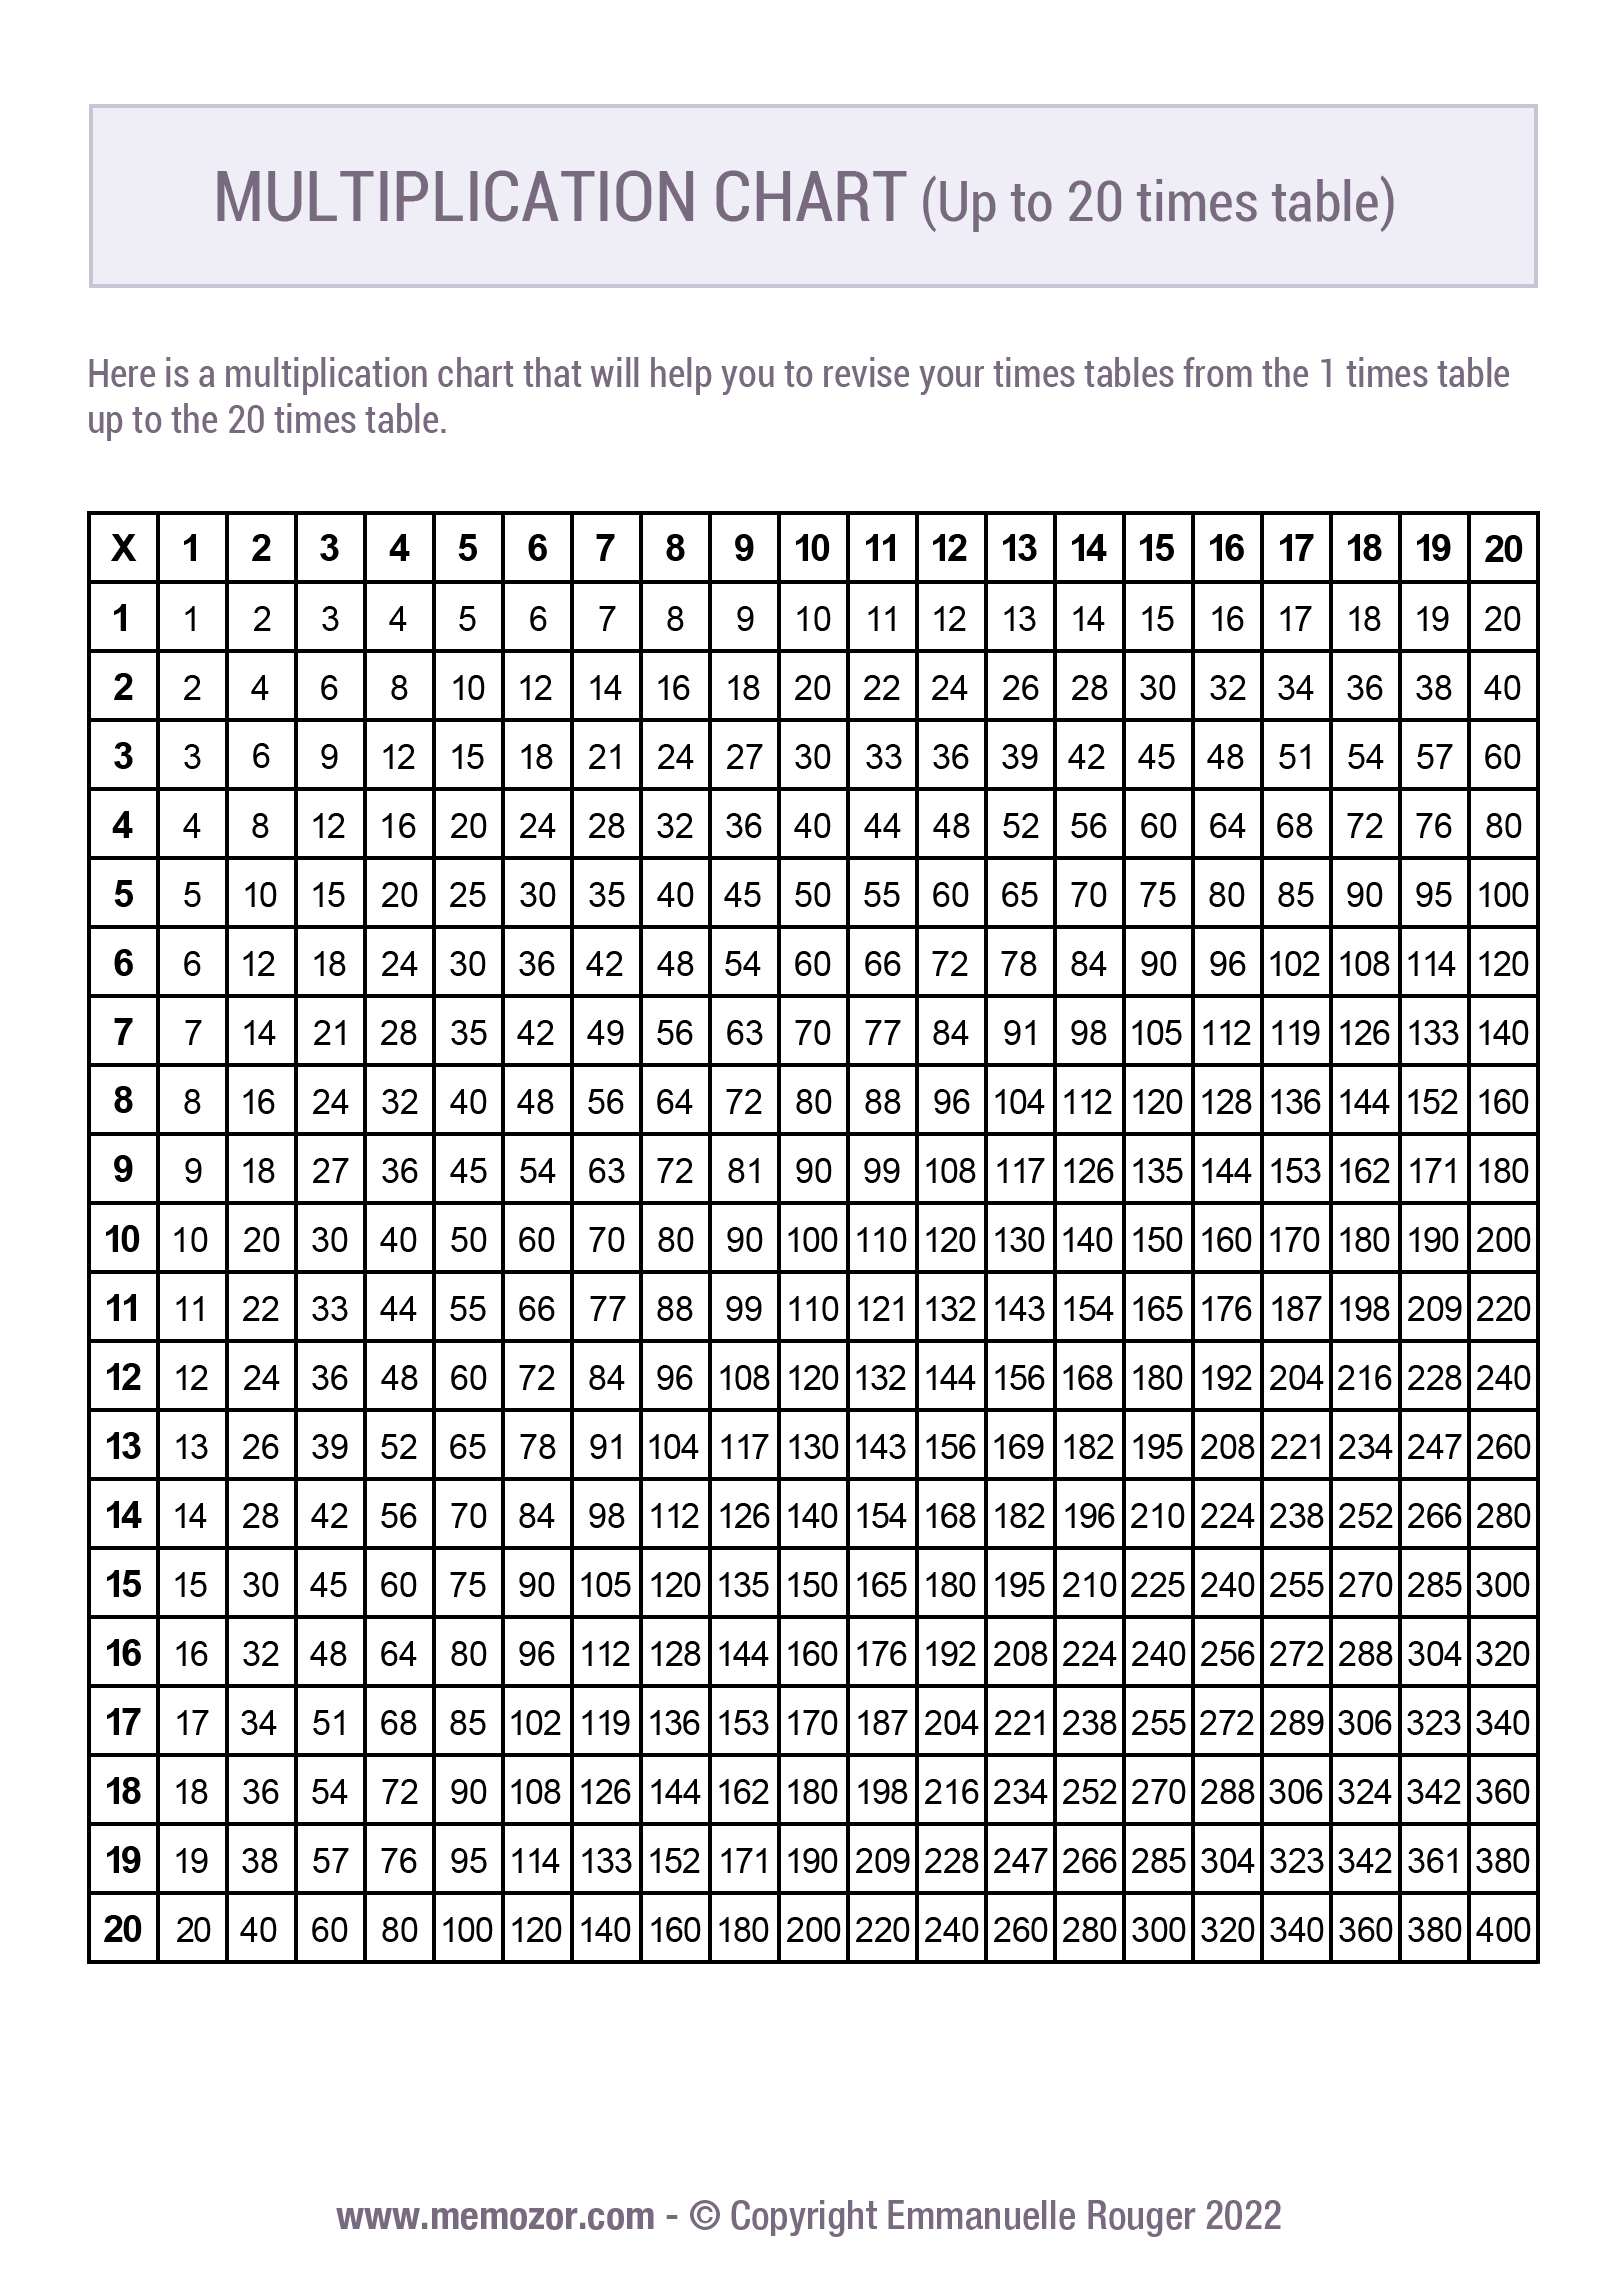
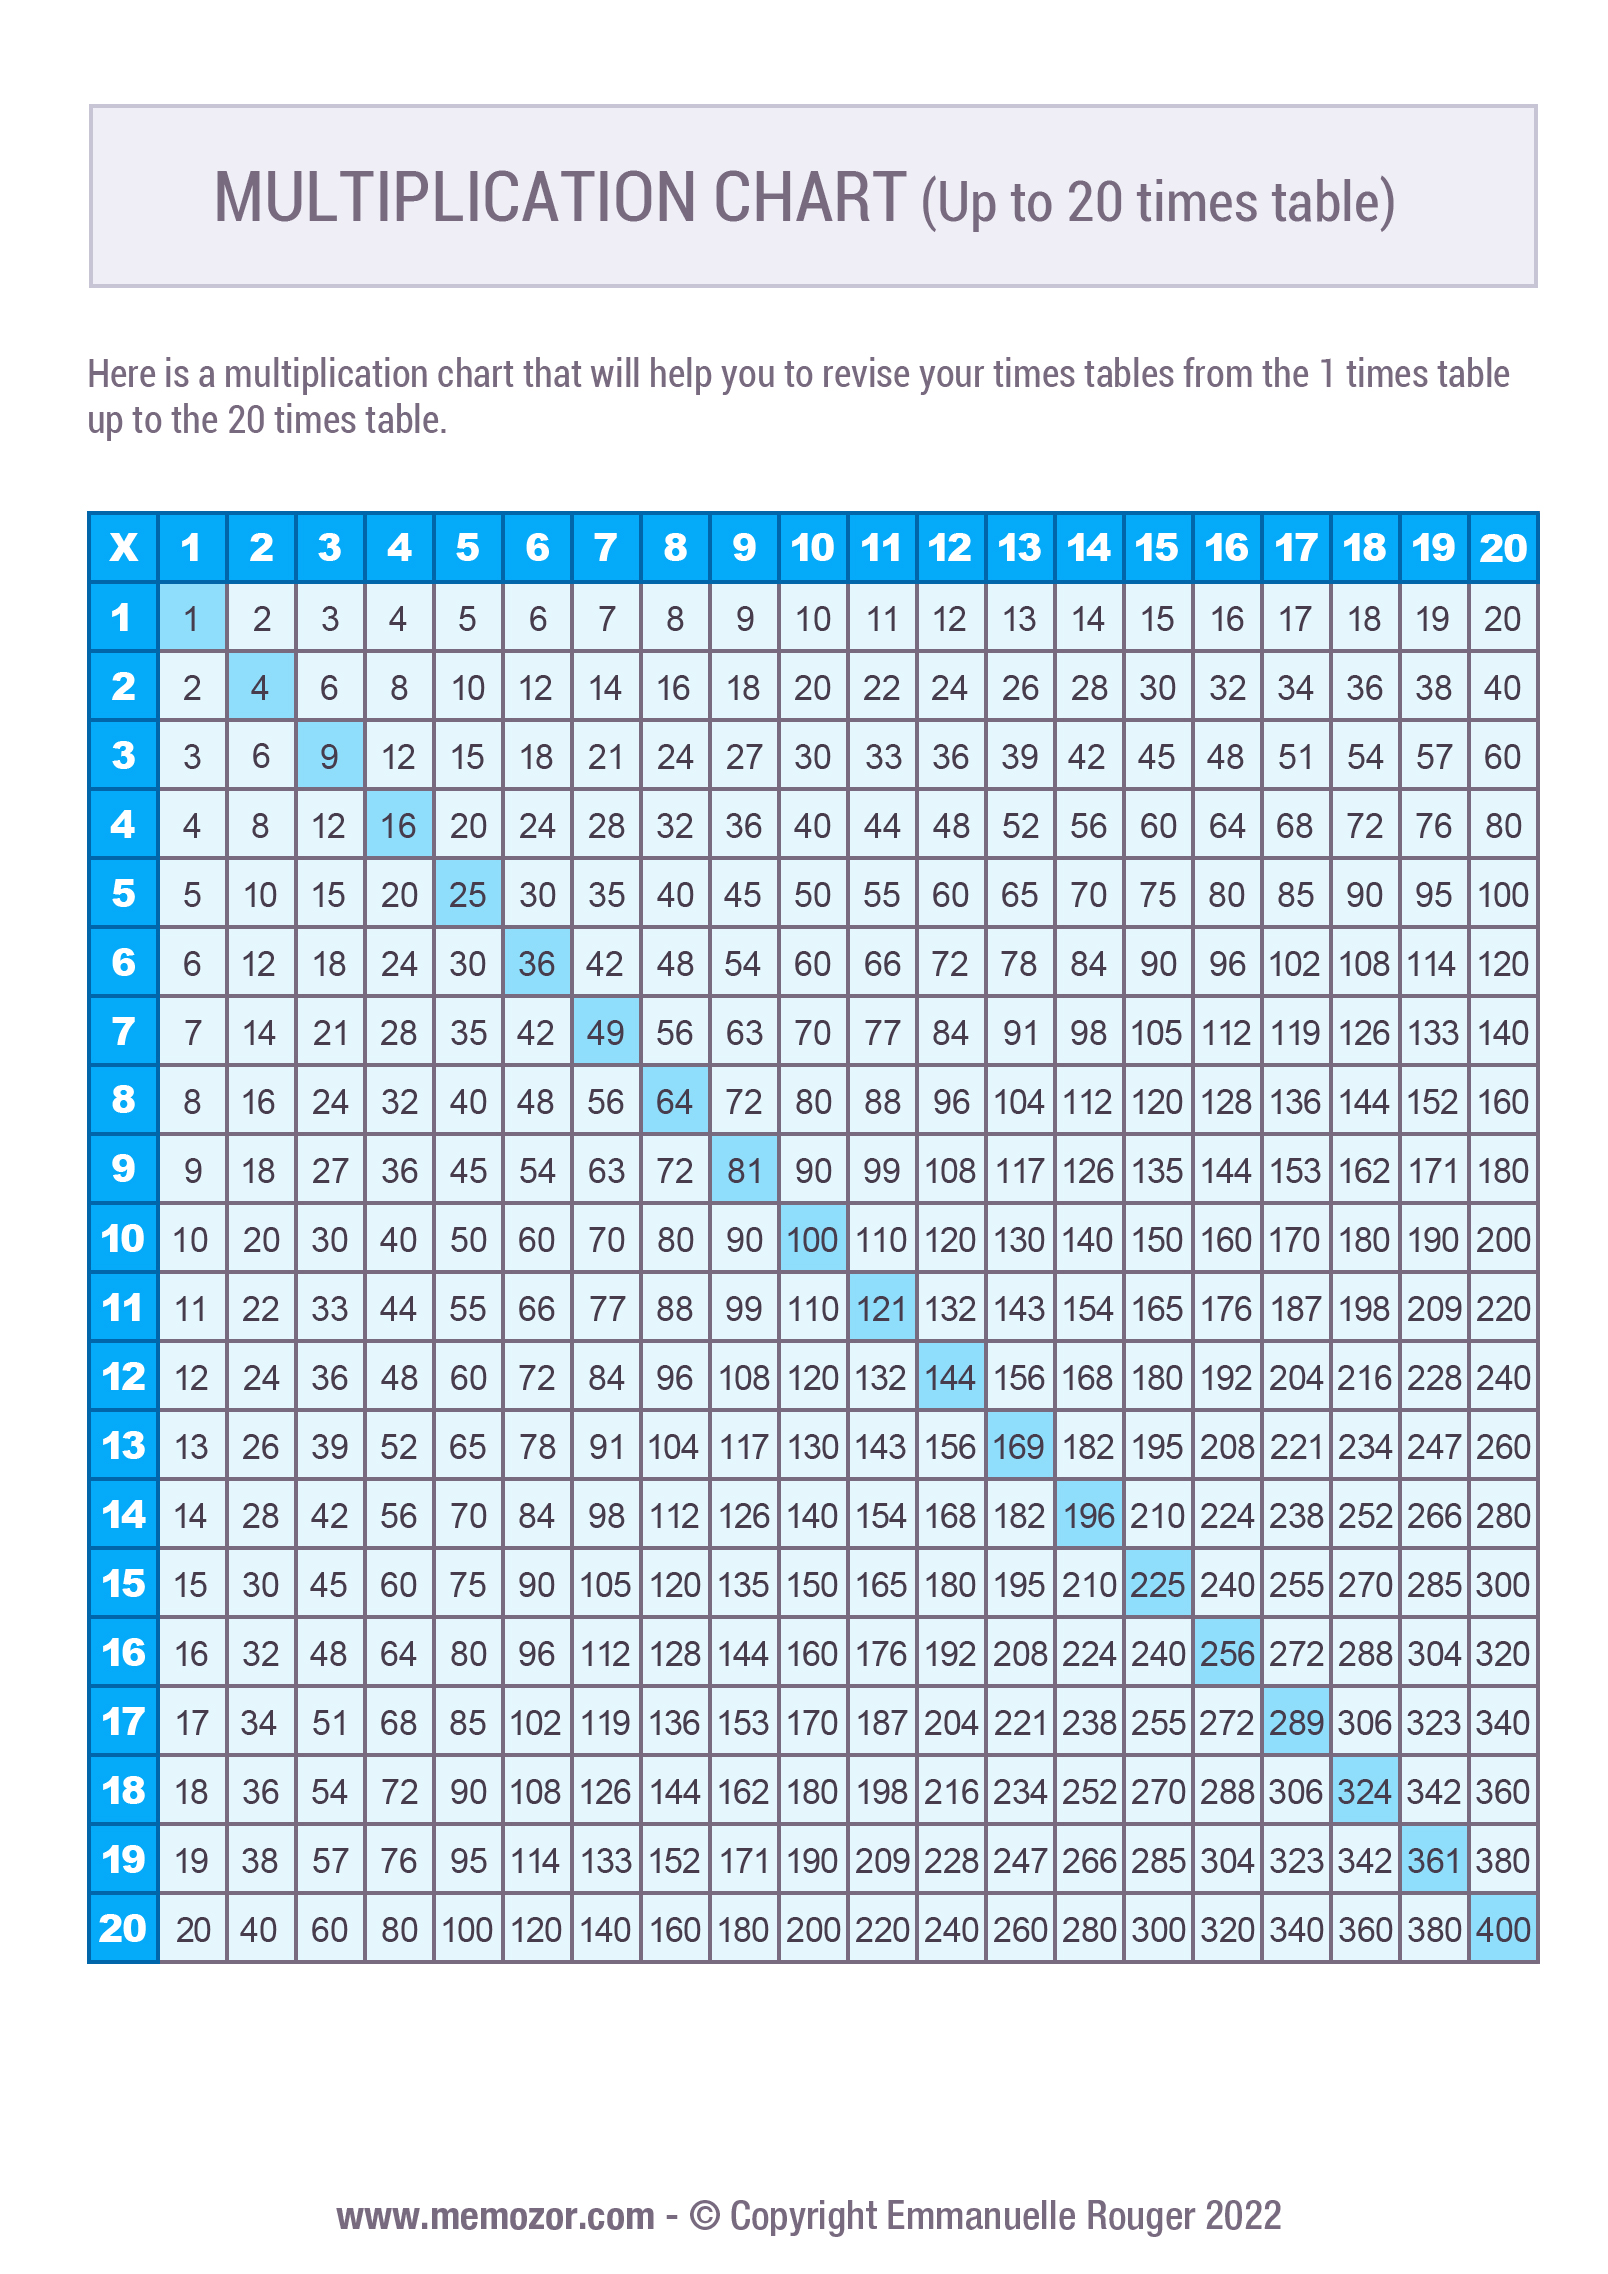
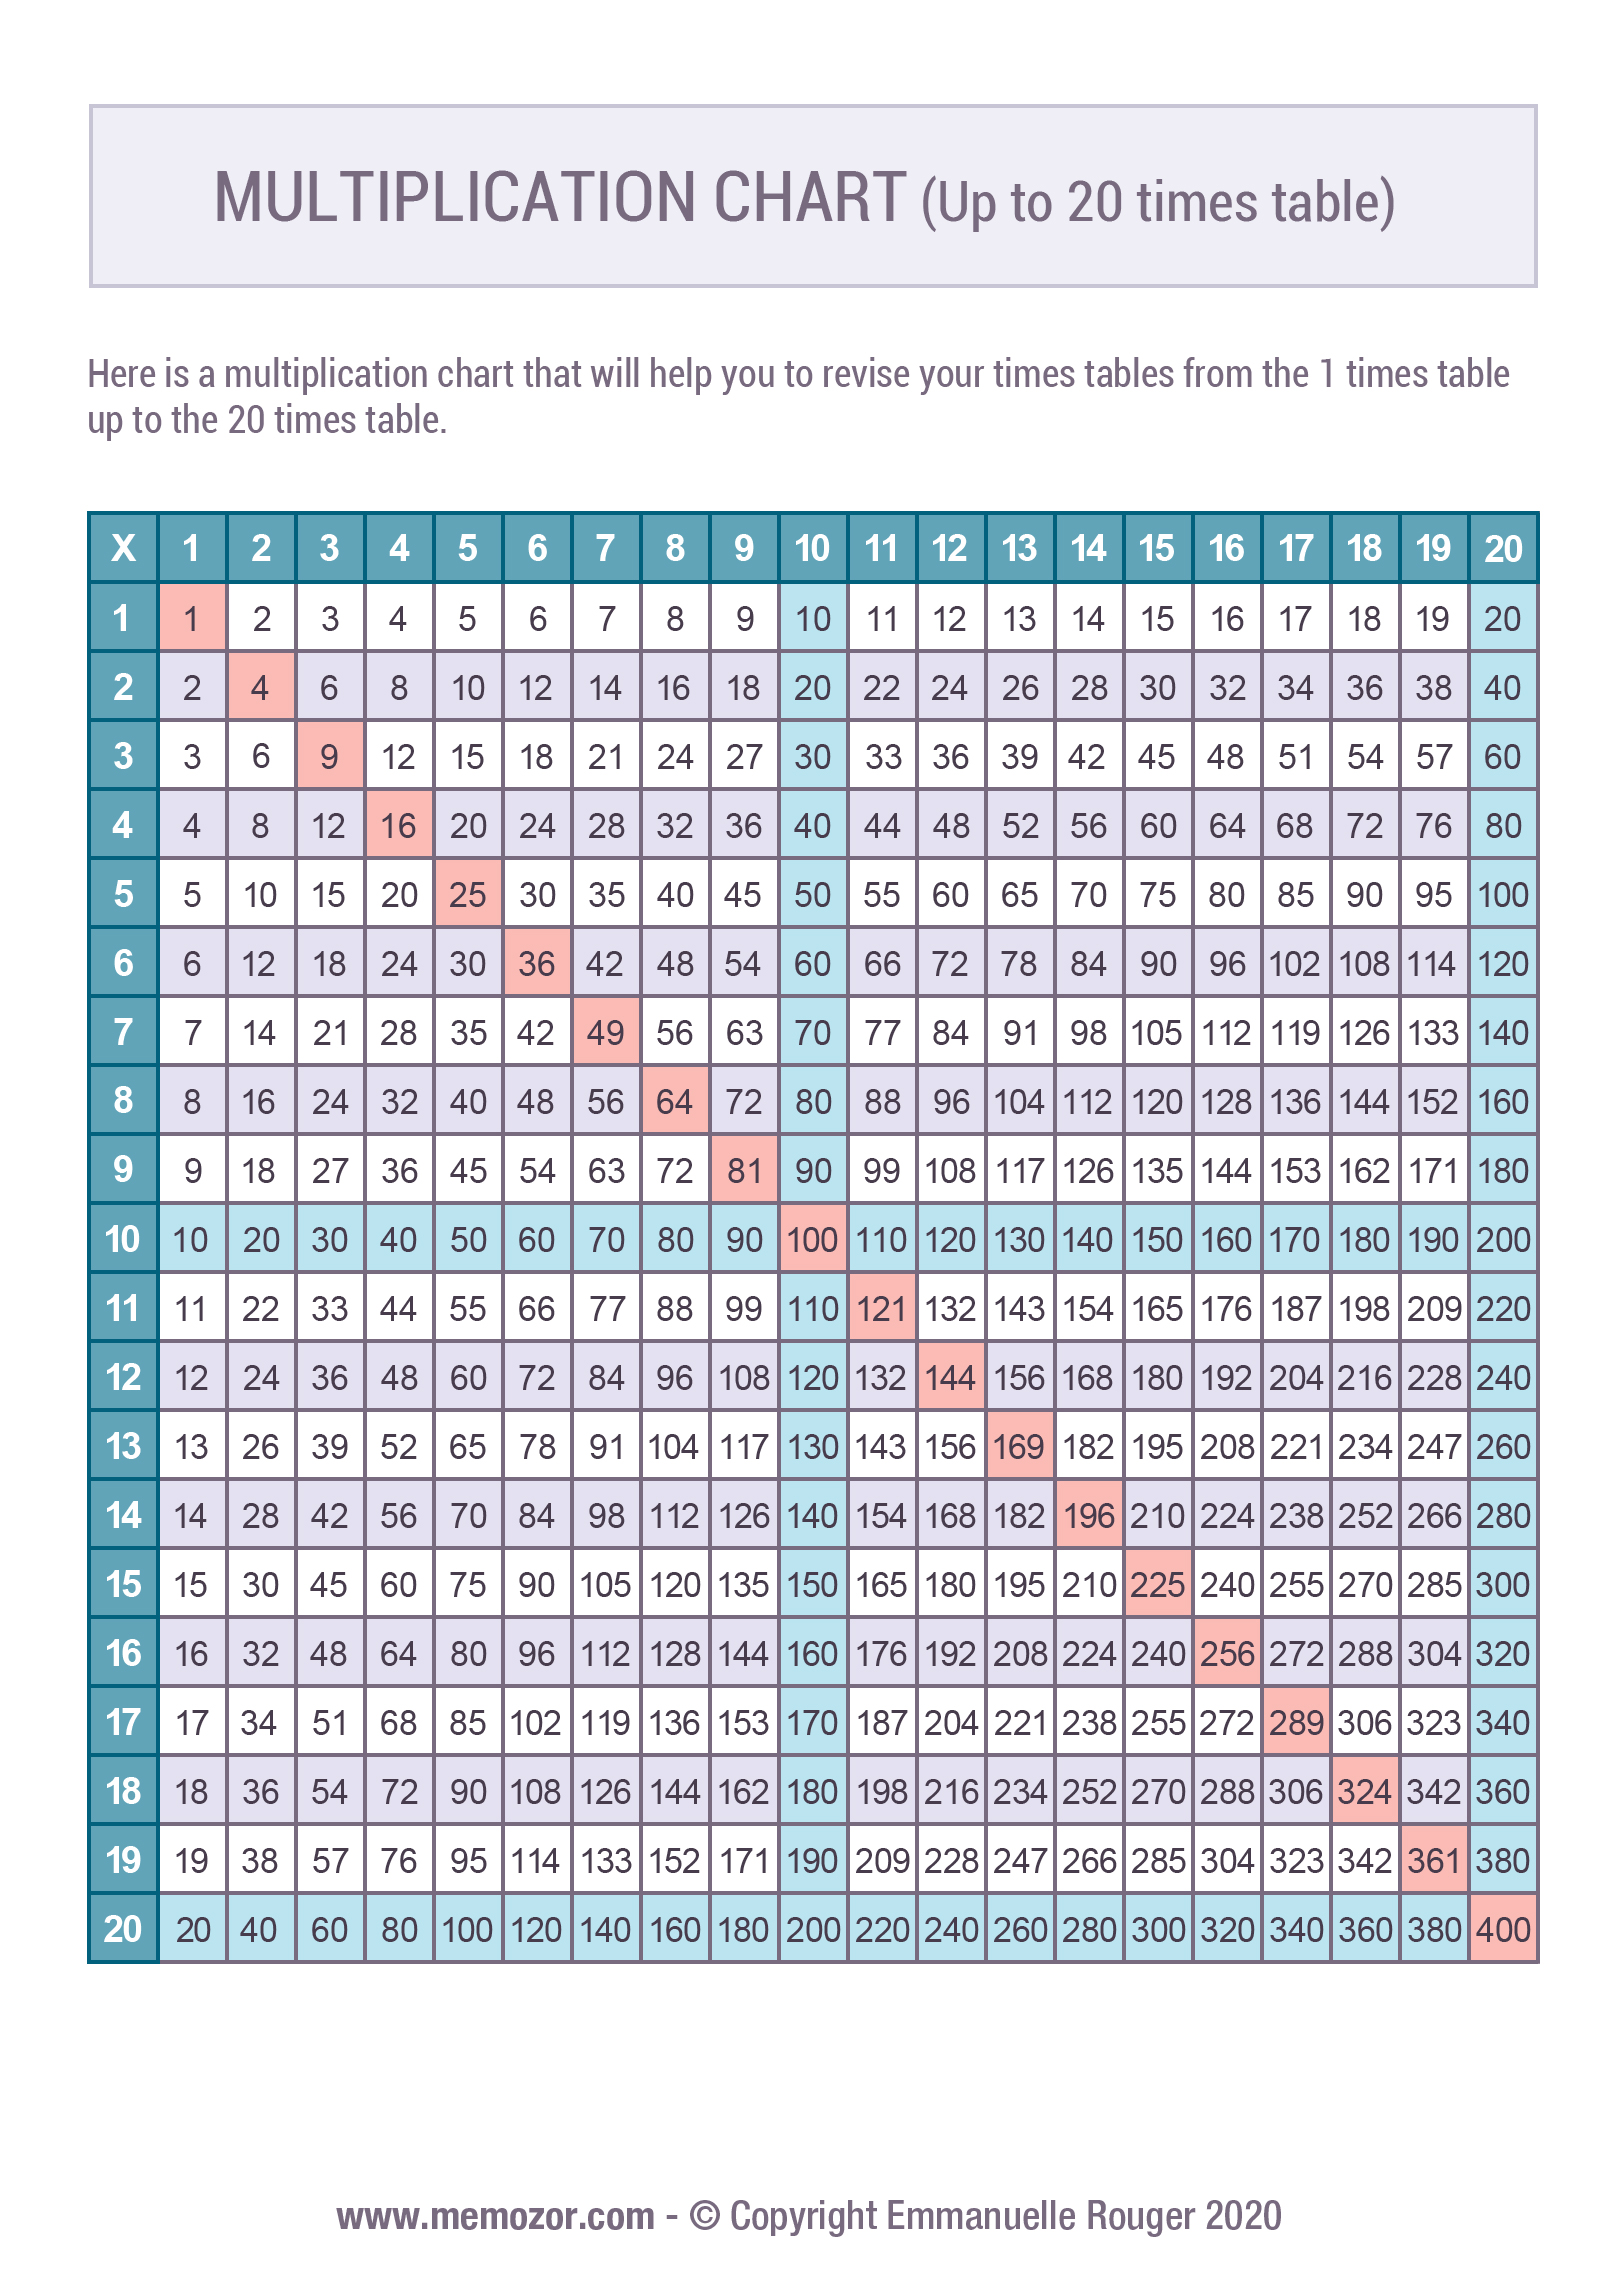
Multiplication charts 1-20
Blank multiplication charts
Online interactive multiplication chart
Thanks to this interactive multiplication chart, you can easily find the answer to any multiplication! Simply hover over or click on a cell with your mouse (or touch a cell with your finger if you're using a tablet or smartphone). It's an easy-to-use tool that makes math more fun!
Thanks to the many available options, you can choose the size of the chart — 10×10 or 12×12 — and customize its appearance by choosing from several themes, including Minecraft, animals, Halloween, and many more. The chart can also be used entirely with the keyboard, making it accessible to visually impaired users.
Interactive multiplication chart: use the arrow keys to move between cells, including row and column headers. Press Enter or Space on a data cell to select it and hear the multiplication result. Press Enter or Space on a column or row header to select it; once a row and a column are selected, the result of the corresponding multiplication is announced automatically. Press Escape to clear the selection. Press Tab to exit the chart.

Loading the multiplication chart — please wait a few seconds
How to use the interactive chart
To find a result, you have two options : click directly on the cell you're interested in, or go step by step : first select the first number of the multiplication in the row header, then the second number in the column header (or vice versa). The chosen row and column are then highlighted, and the result appears instantly at their intersection.
Simple and fun, this tool requires no installation : it runs directly in your browser, on any device.
In terms of accessibility, keyboard navigation is available using the arrow keys, which let you move between cells, including the row and column headers. You can move directly to the cell you're interested in, or select the correct row and then the correct column in the headers to hear the result right away, without having to navigate to the cell itself. Press Enter or Space on a data cell to select it and hear its result. The Escape key clears the selection, and the Tab key exits the chart.
Origin: the Pythagorean table

It was Pythagoras, the famous mathematician and philosopher of ancient Greece — best known for the Pythagorean theorem, which describes the relationship between the side lengths of a right triangle — who came up with the idea of organizing multiplication tables inside a chart. Hence the name "Pythagorean Table", often used to refer to the multiplication chart. Particularly practical, it lets you instantly find the result of any multiplication.
Born around 570 BC on the island of Samos, in the Aegean Sea, he is often referred to as "Pythagoras of Samos". Later in life, he settled in southern Italy, where he founded his school of thought: Pythagoreanism. His influence on philosophy, mathematics, and science remains considerable to this day.
* The illustration above is a detail from the famous fresco "The School of Athens", a masterpiece by the Italian painter Raphael.
How to read a multiplication chart?
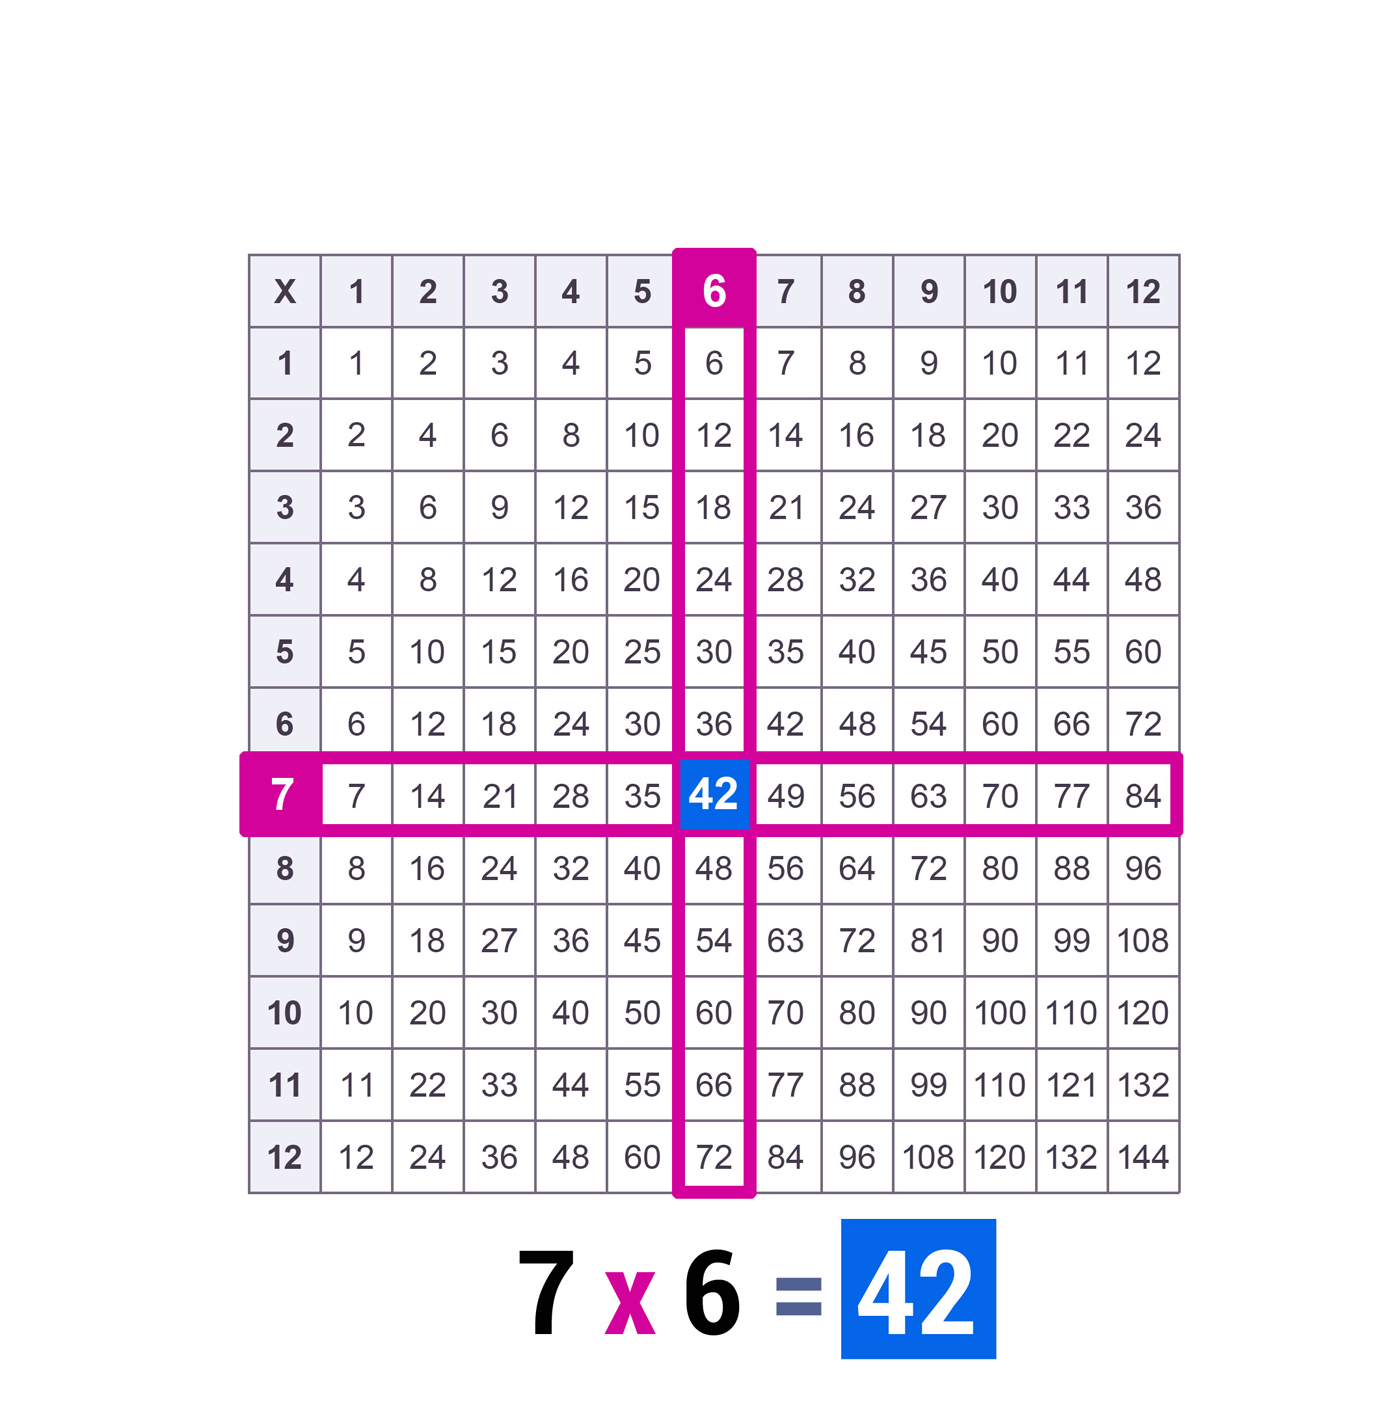
To find the result of a multiplication, simply look for the intersection between the horizontal row of the first number and the vertical column of the second. You can use your finger to slide along each line until they meet.
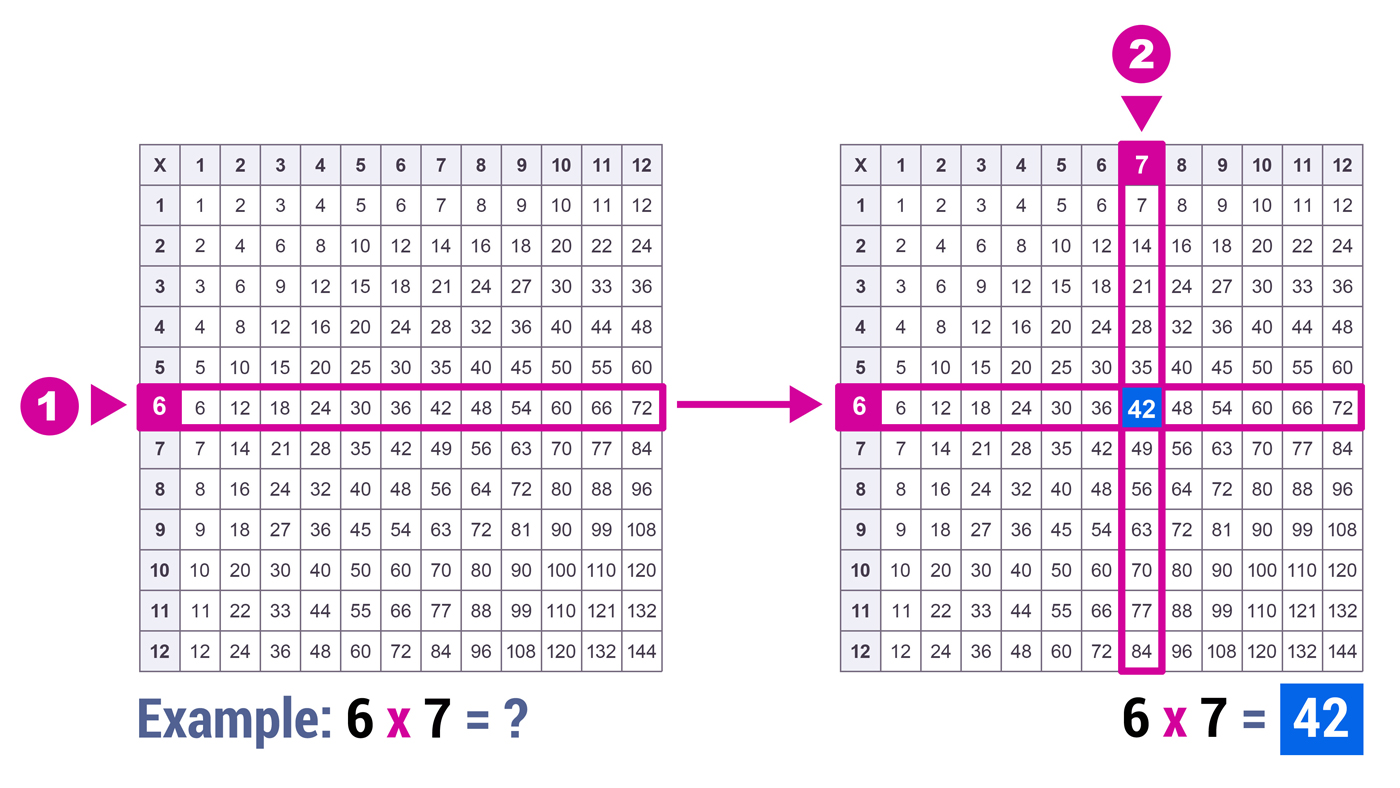
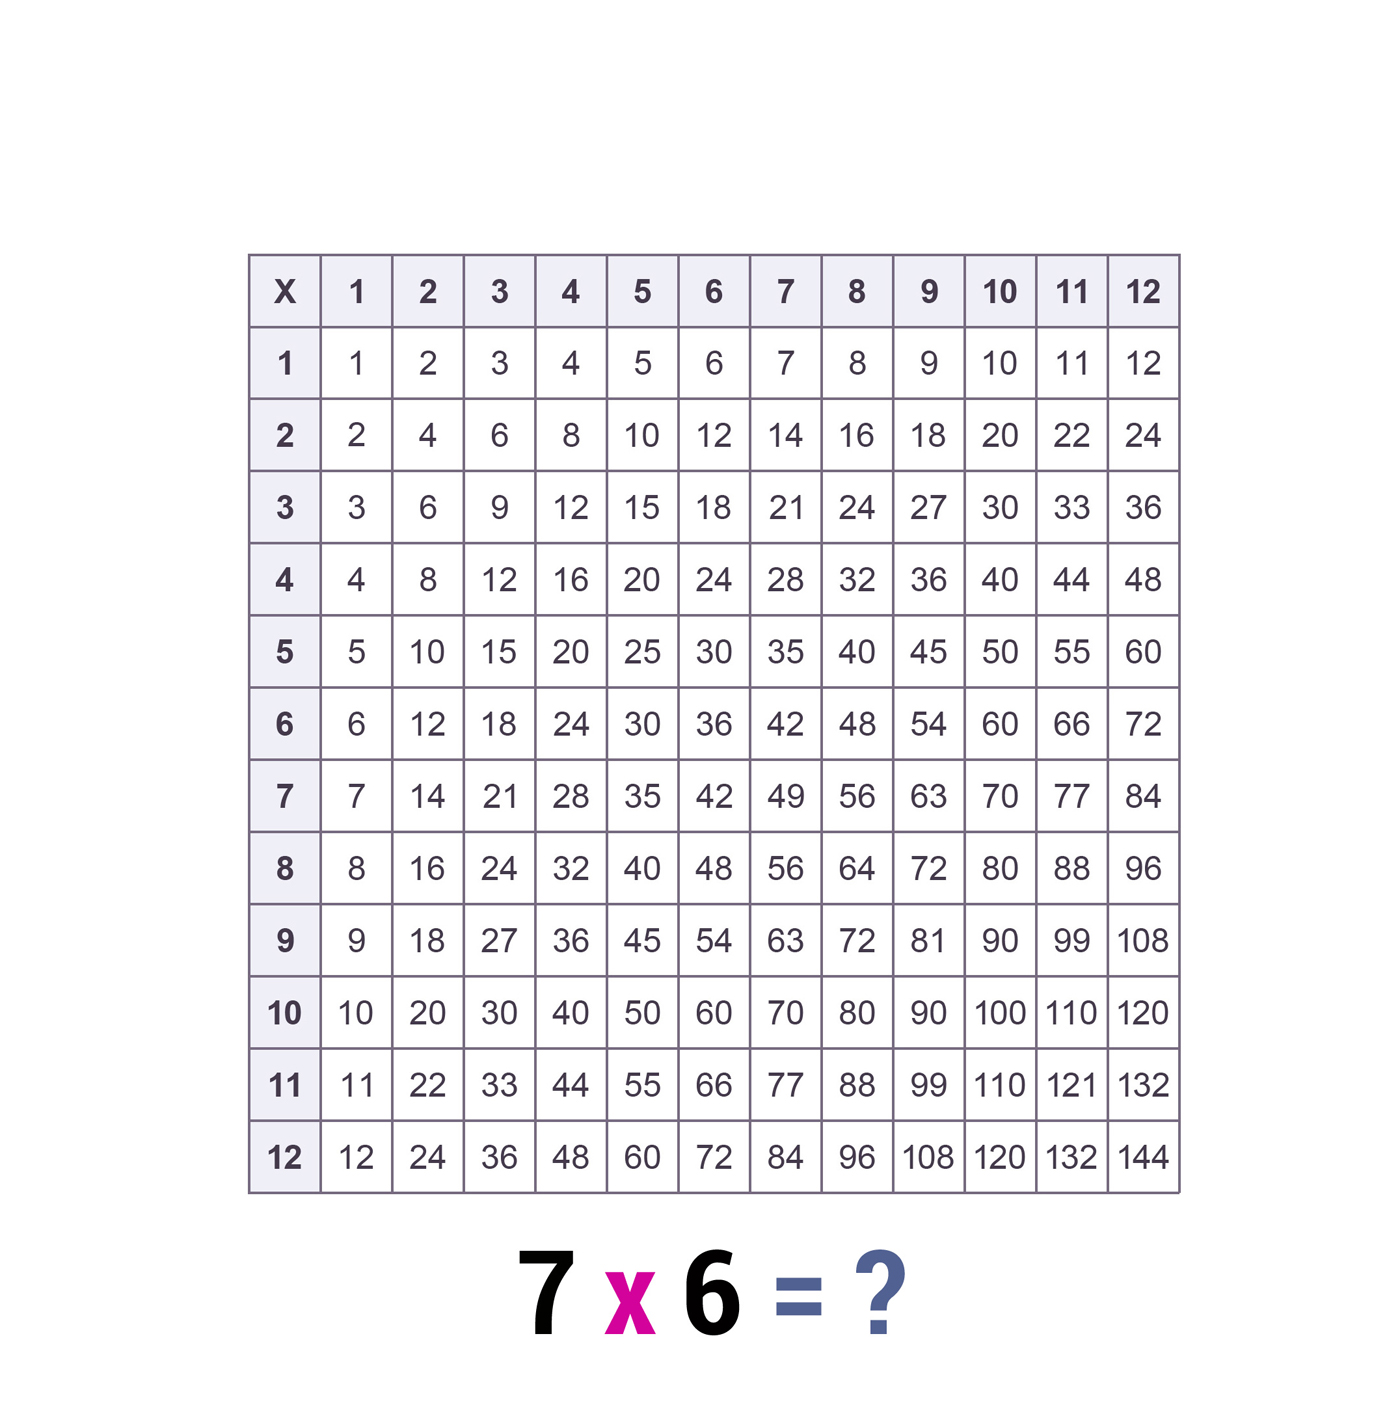
Let's take an example: what is the result of 7 x 6?
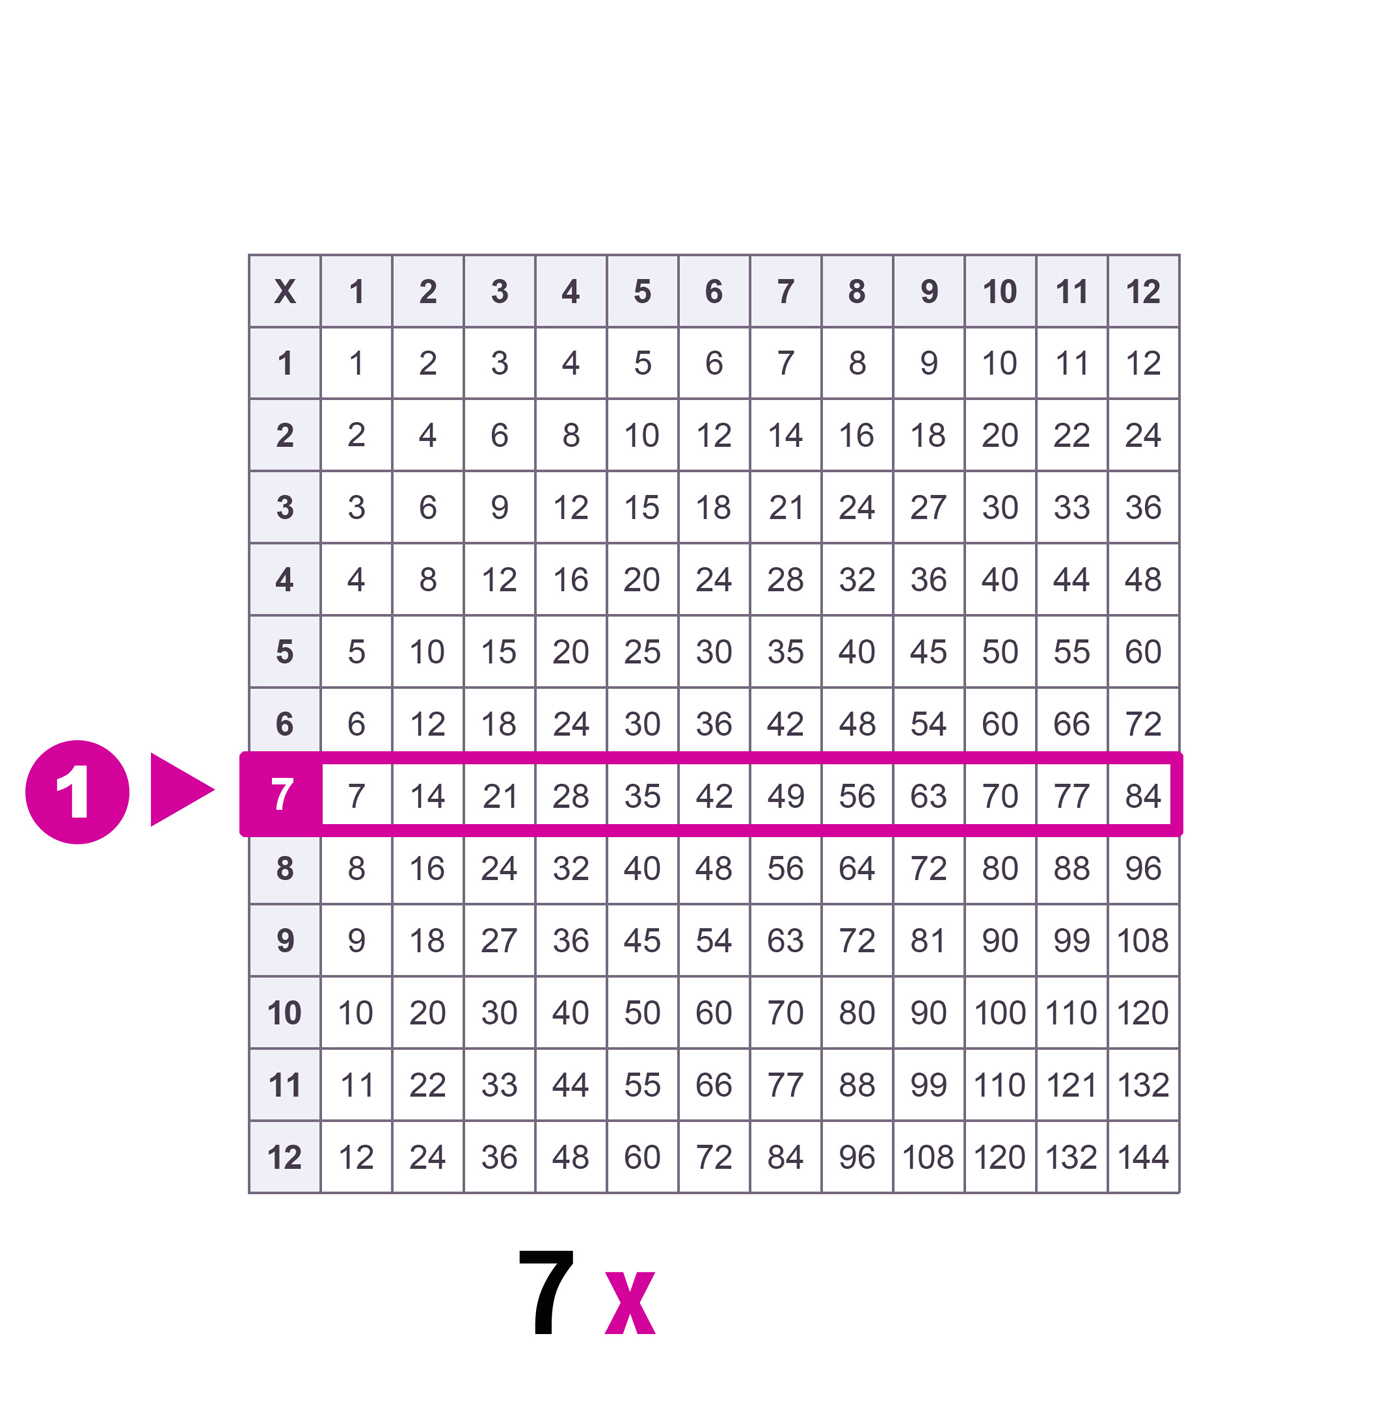
- 1- Find in the chart the horizontal row corresponding to the first number (here, 7).
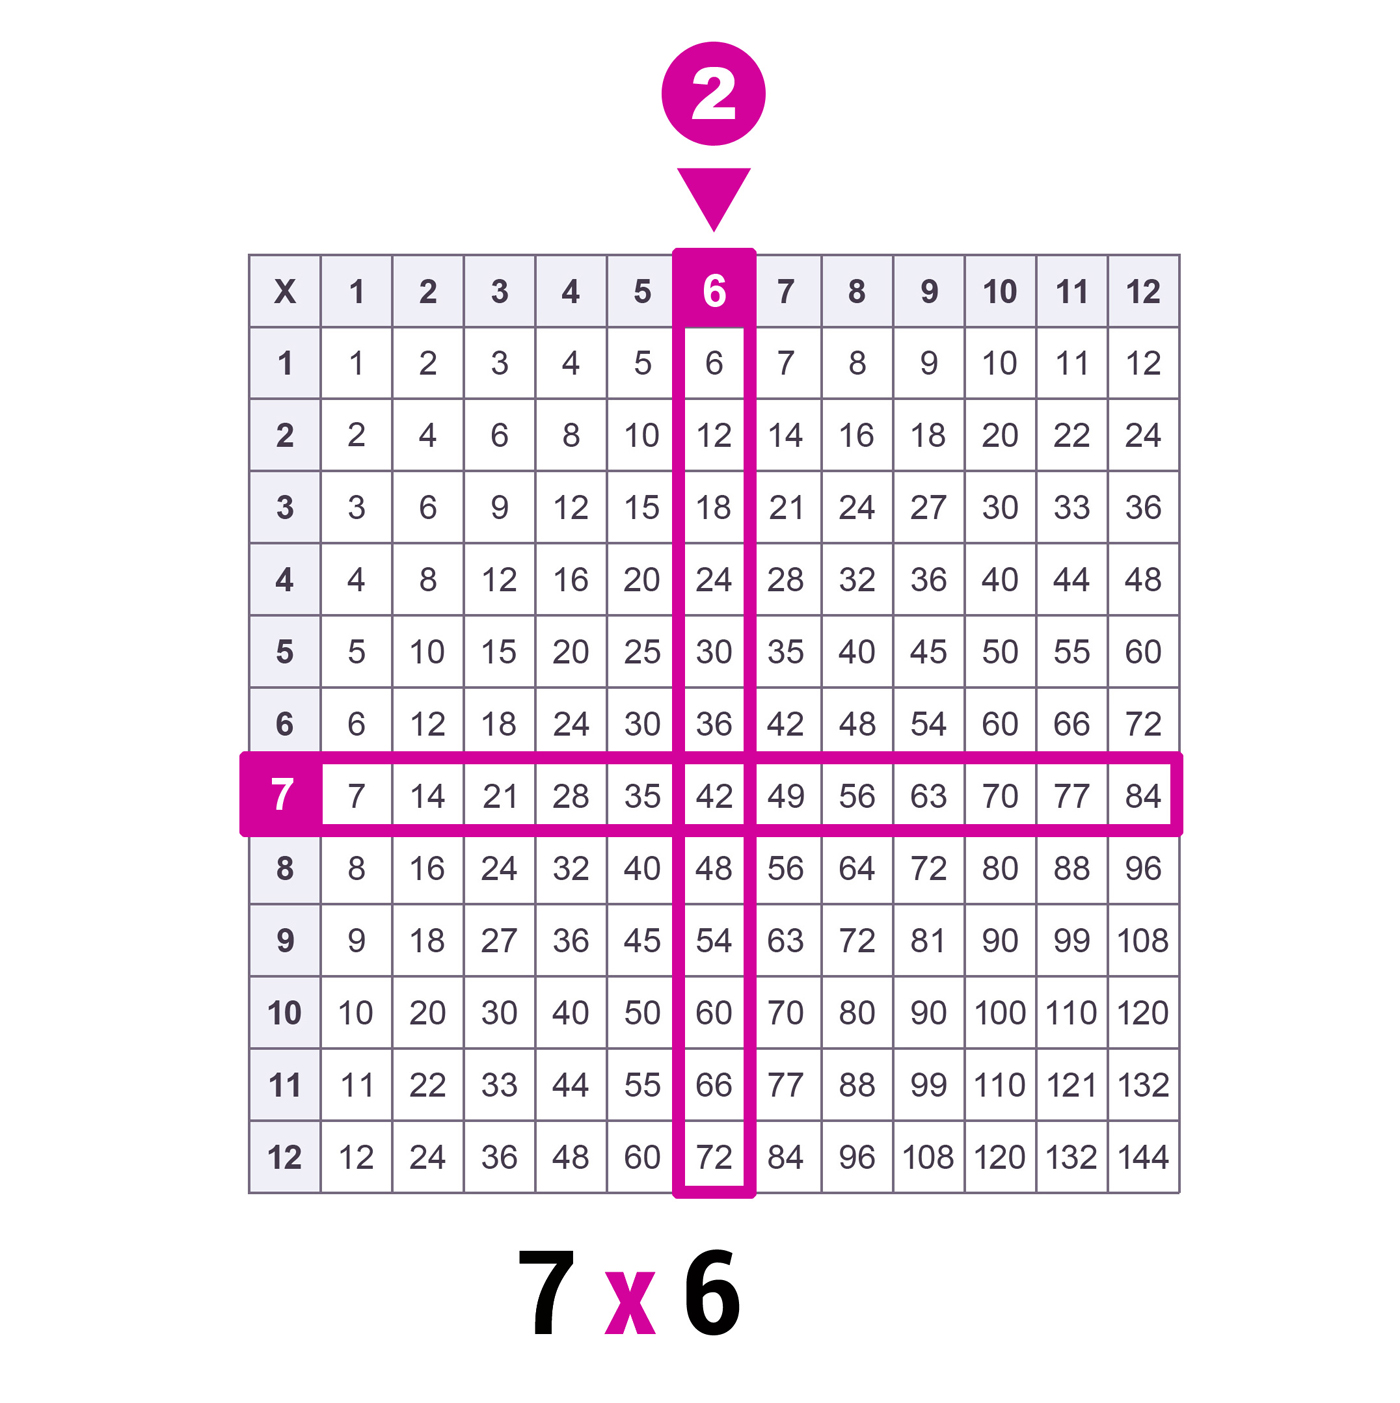
- 2- Then find the vertical column corresponding to the second number (here, 6).
- 3- The result is in the cell at the intersection of the two lines: 7 x 6 = 42.
You'll notice that looking up 6 x 7 the same way gives you the exact same result. This is what's known as the commutative property of multiplication!
1- Step-by-step method for reading a multiplication chart
-
 How to find the result of 7 x 6?
 -
 Find the horizontal row for 7
 -
 Find the vertical column for 6
 -
 The result at the intersection: 7 x 6 = 42
2- The commutative property of multiplication
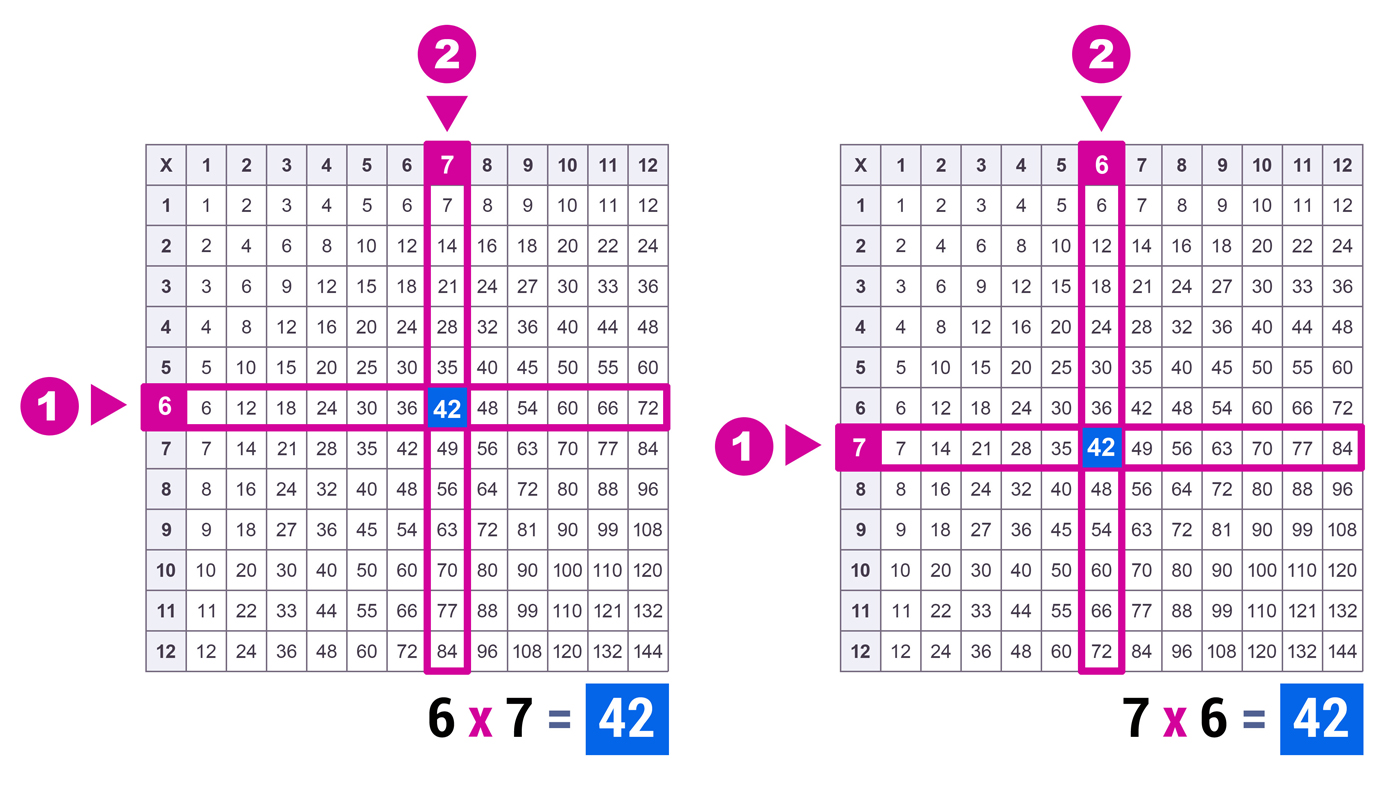
Your math teacher has probably already mentioned the commutative property of multiplication. It simply means that, regardless of the order of the numbers in a multiplication, the result is always the same!
Commutativity of multiplication:
a x b = b x a
To illustrate this property, we compared the results of 7 x 6 and 6 x 7 in a multiplication chart. You'll notice that both intersections give exactly the same result.
Note: This property applies regardless of the number of factors. For example: 2 x 3 x 4 = 2 x 4 x 3 = 4 x 3 x 2 = …
3- The diagonal of the chart and square numbers
 The diagonal and square numbers
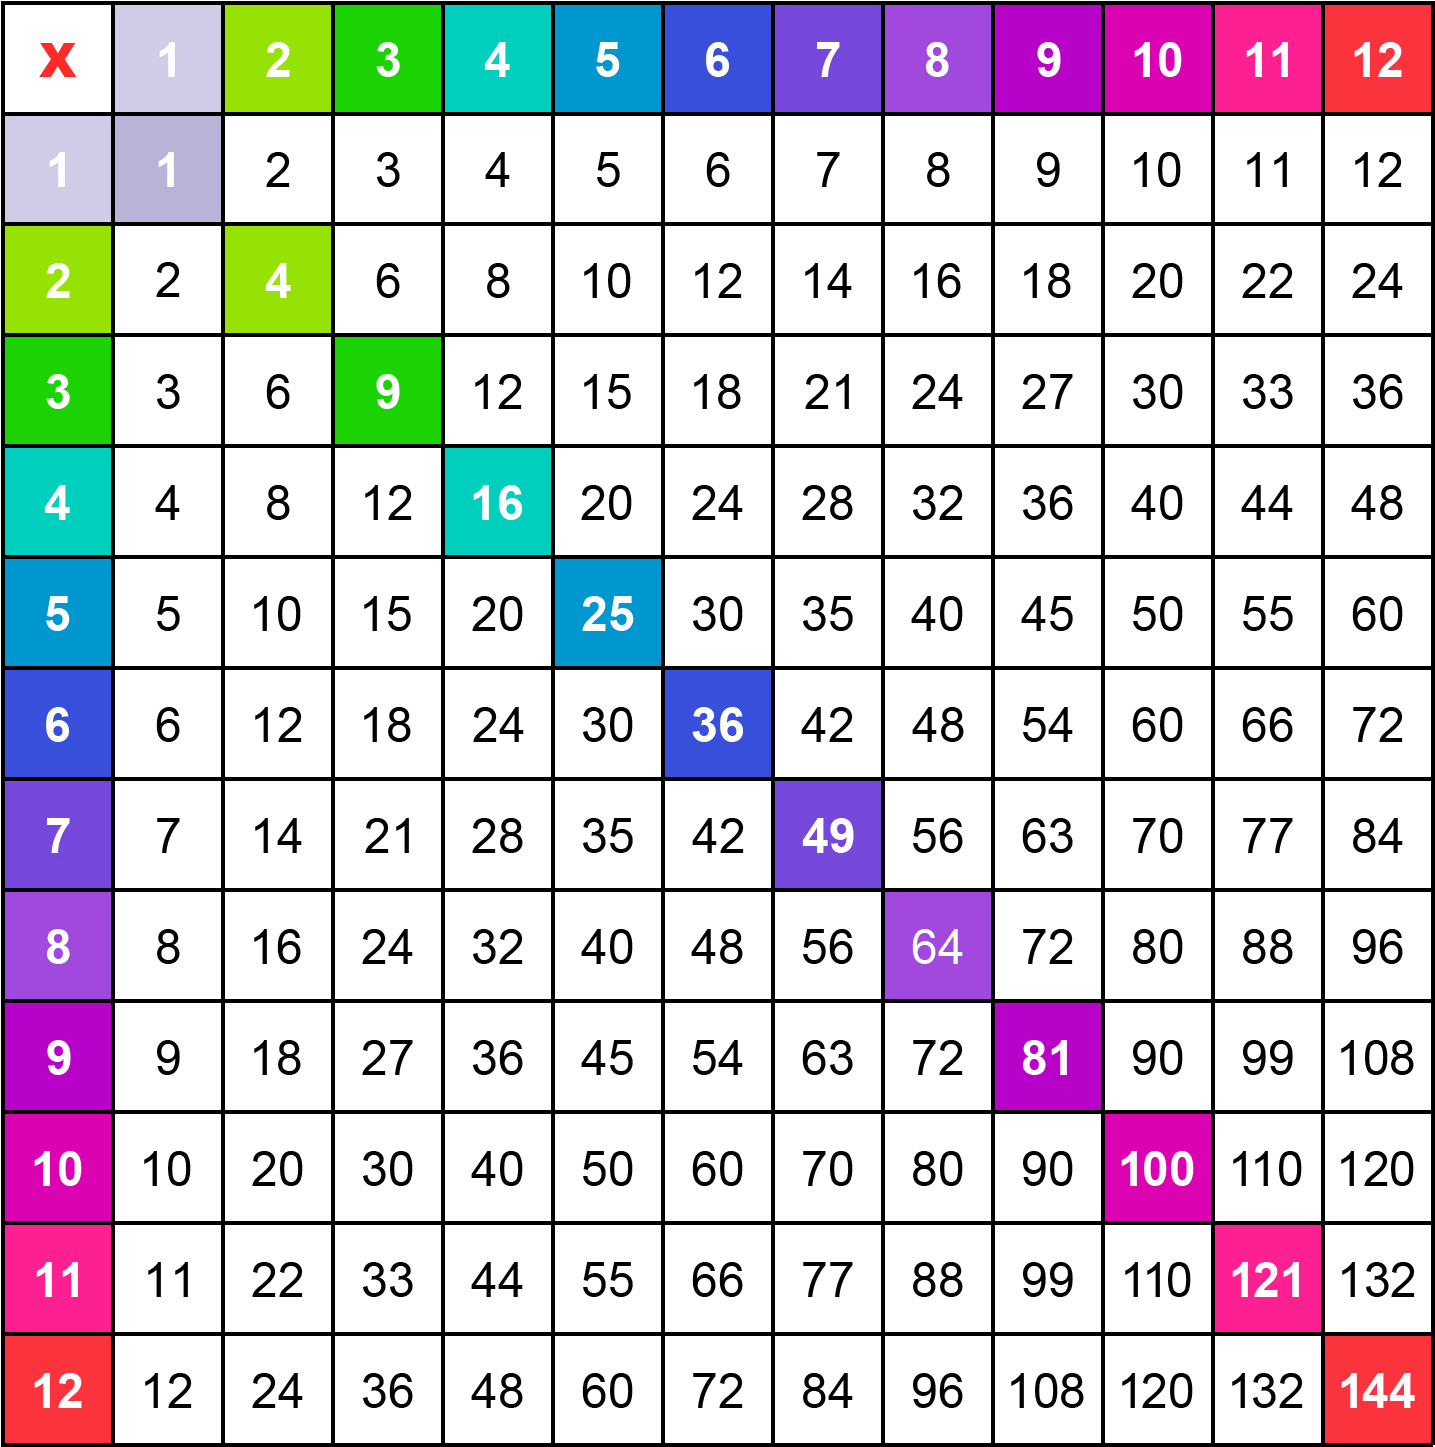
The diagonal of a multiplication chart is made up of the cells where the row number equals the column number. The numbers along the diagonal represent square numbers: they are the result of multiplying a number by itself. For example, 36 is the square of 6, because 6 x 6 = 36. In mathematical notation, we write 6 x 6 = 6², read as "6 squared" or "6 to the power of 2".
A square number:
a x a = a²
To help visualize the diagonal, we used a color chart. In this example, it runs from the top-left corner — the square of 1 — all the way to the bottom-right corner — the square of 12, which is 144.
In a 12x12 chart,
the square numbers are:
- 1 x 1 = 1² = 1
- 2 x 2 = 2² = 4
- 3 x 3 = 3² = 9
- 4 x 4 = 4² = 16
- 5 x 5 = 5² = 25
- 6 x 6 = 6² = 36
- 7 x 7 = 7² = 49
- 8 x 8 = 8² = 64
- 9 x 9 = 9² = 81
- 10 x 10 = 10² = 100
- 11 x 11 = 11² = 121
- 12 x 12 = 12² = 144
How to learn a multiplication chart?
At first glance, a multiplication chart can seem overwhelming. But rest assured: with a few tips and tricks, you'll quickly realize that there are actually very few multiplications to memorize by heart!
1- Bring color into your chart!
Adding color to your chart is not only a great way to brighten up your study sessions, but above all an excellent tool to boost memorization — especially if you have a visual memory. We offer 3 solutions:
- You can create a custom chart with your favorite colors: print a black and white multiplication chart and grab your markers or colored pencils!
- To save time, pick a ready-made color chart from our printable 10×10 multiplication charts or 12×12 multiplication charts.
- You can also use our interactive online multiplication chart, fully customizable with many options — you can even change the background scenery for more fun!
 Coloring a multiplication chart
Some tips for adding color to your chart:
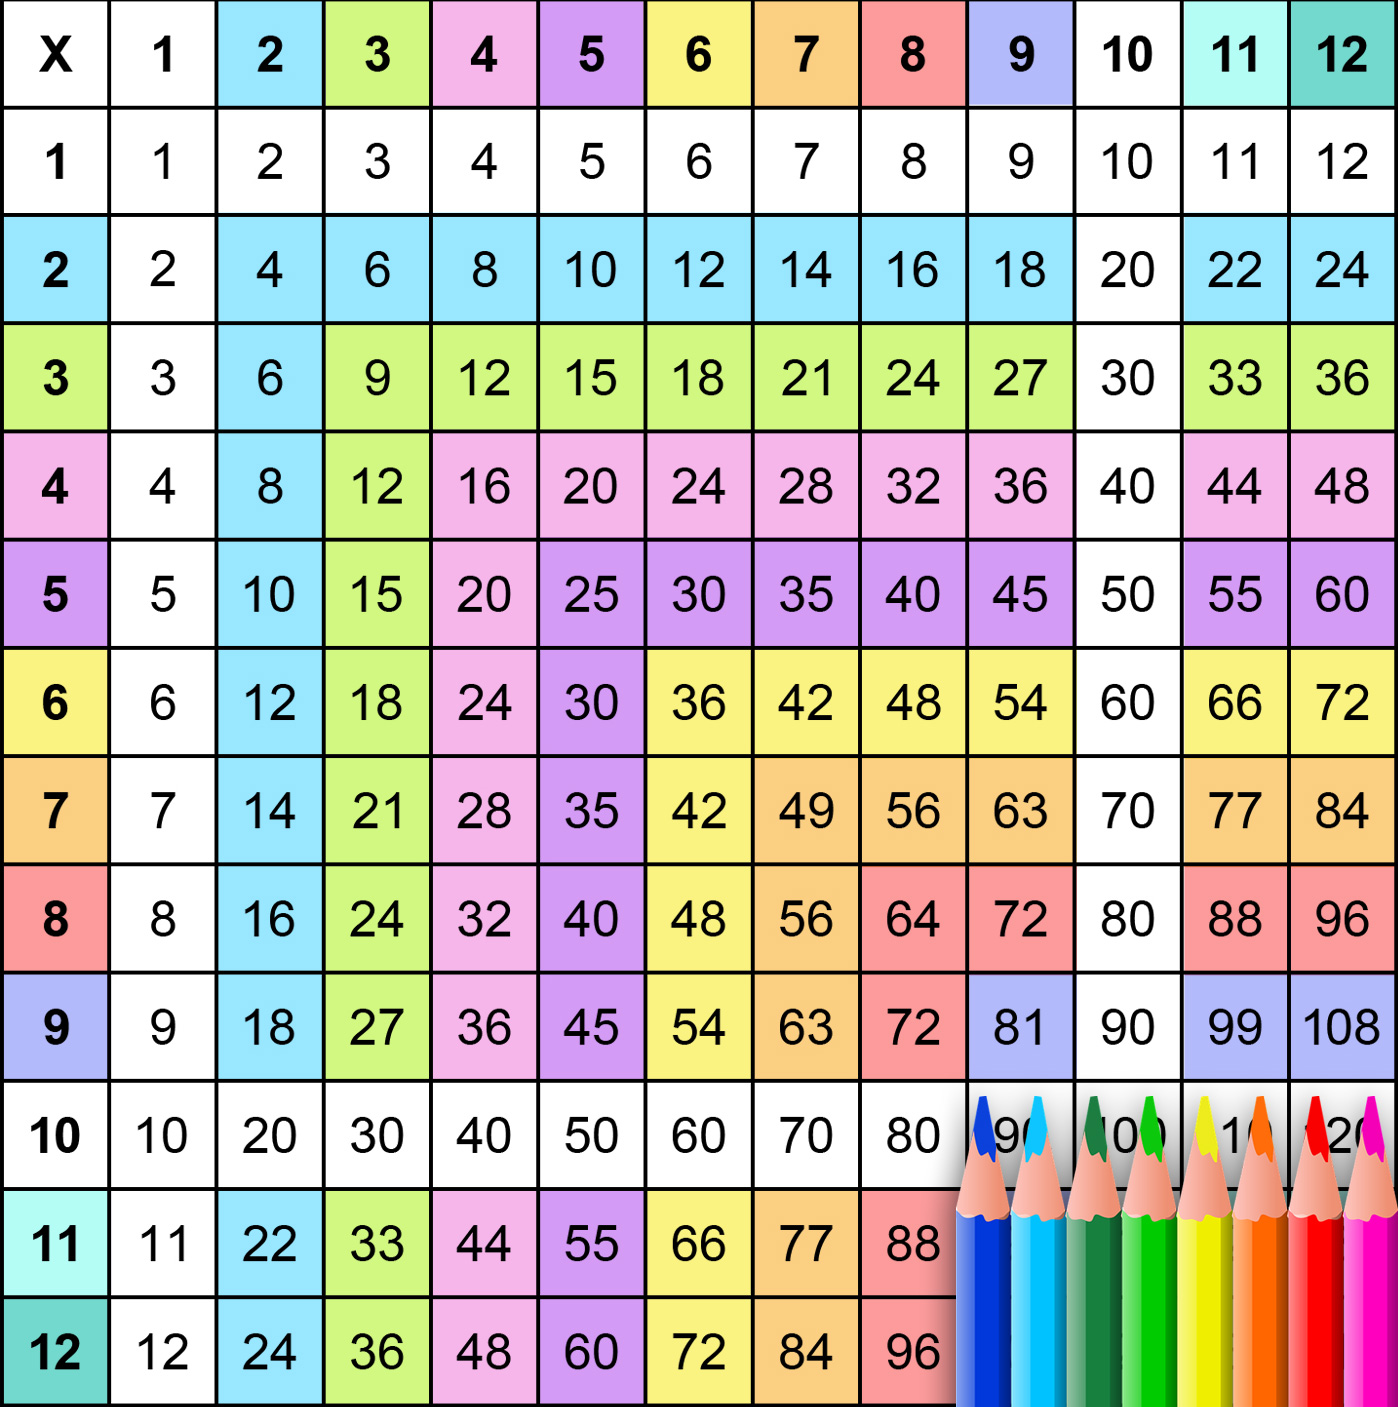
Choose a different color for each times table — this is what we call a color code. This color will be used on both the horizontal row and the vertical column for that table.
Let's take a concrete example:
If you assign green to the 3 times table, color the following cells in green: 3×3, 3×4, 3×5, 3×6, 3×7, 3×8, 3×9 (horizontal row) as well as 4×3, 5×3, 6×3, 7×3, 8×3, 9×3 (vertical column). However, 3×2 belongs to the 2 times table: color it with the color of the 2 times table. Since 3×2 = 2×3, there's no need to learn both — knowing one means knowing the other!
Note: No need to color the cells for the 1 and 10 times tables — you'll see why just below!
2- No need to learn the whole multiplication chart!
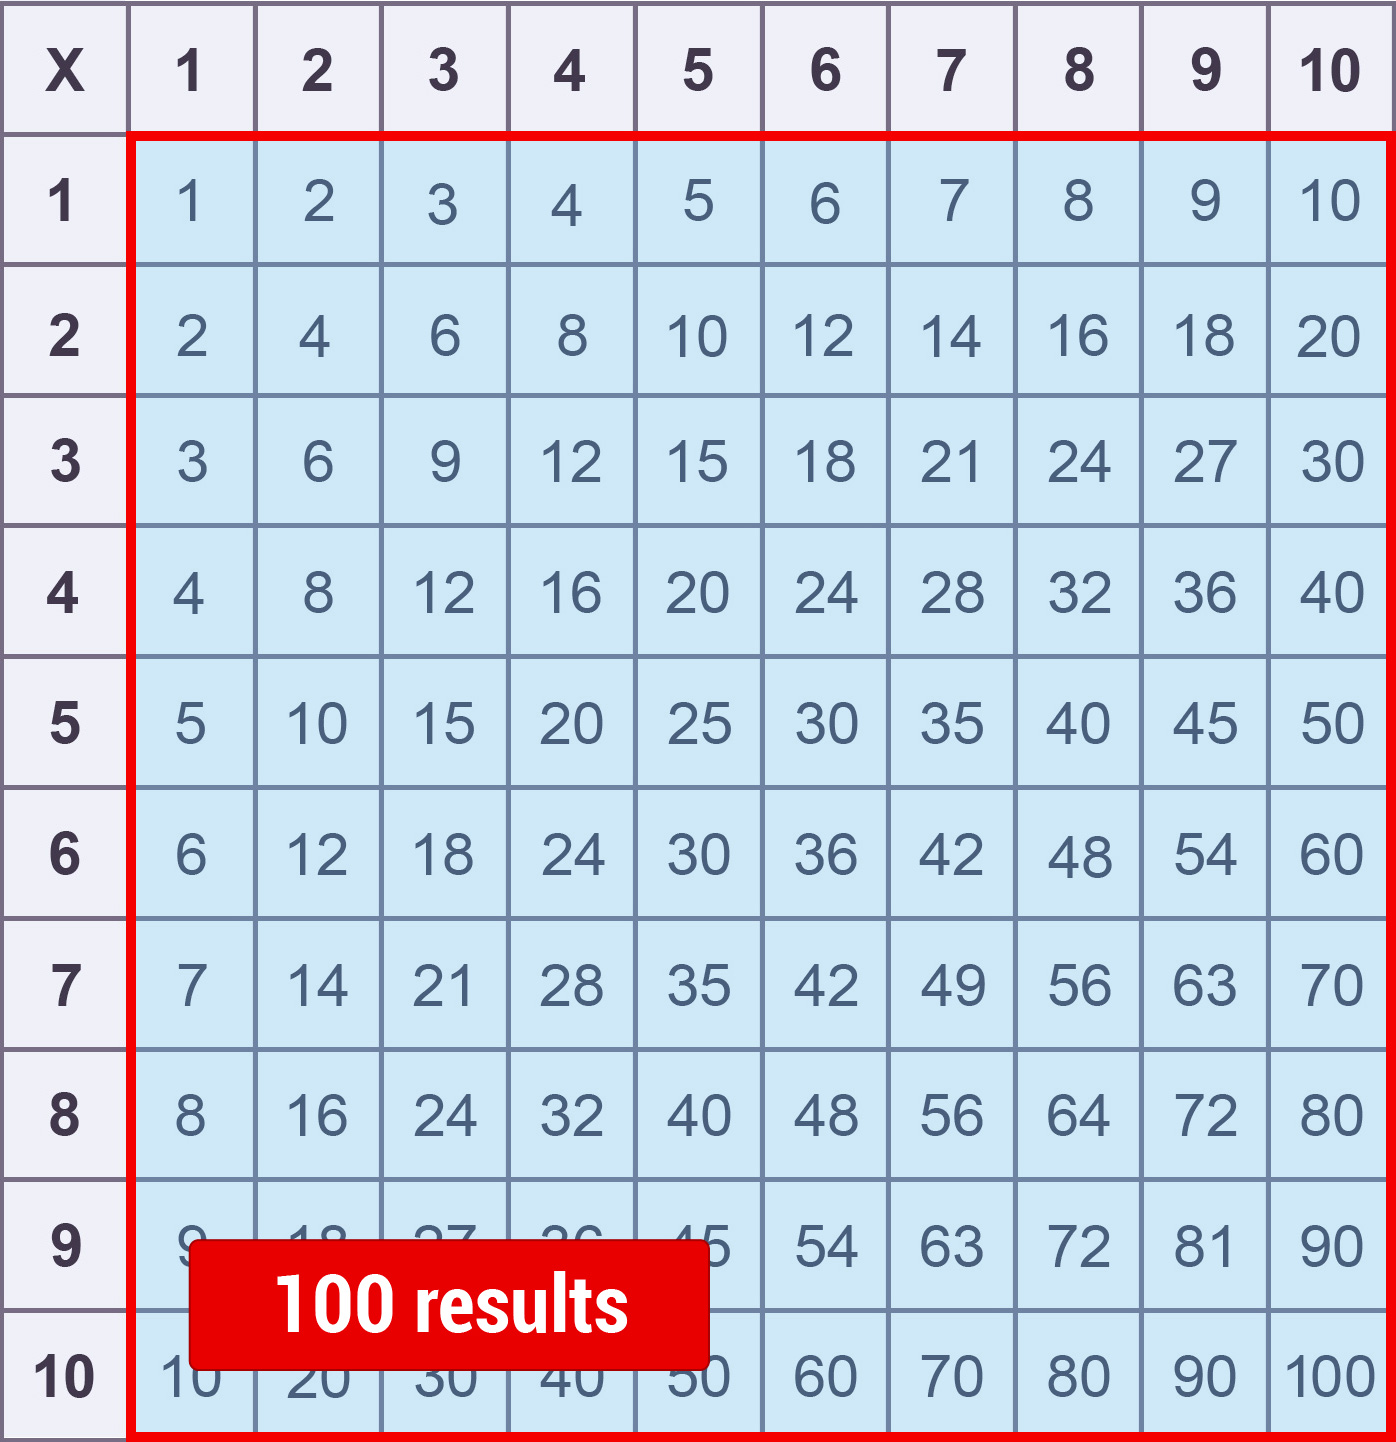 Number of results in a multiplication chart
How many results are in a multiplication chart?
A 10×10 chart contains 100 cells, so 100 results. That may sound like a lot — but great news! In reality, there are only 36 multiplications you truly need to know, or even as few as 28 with a few tricks. Let us show you how!
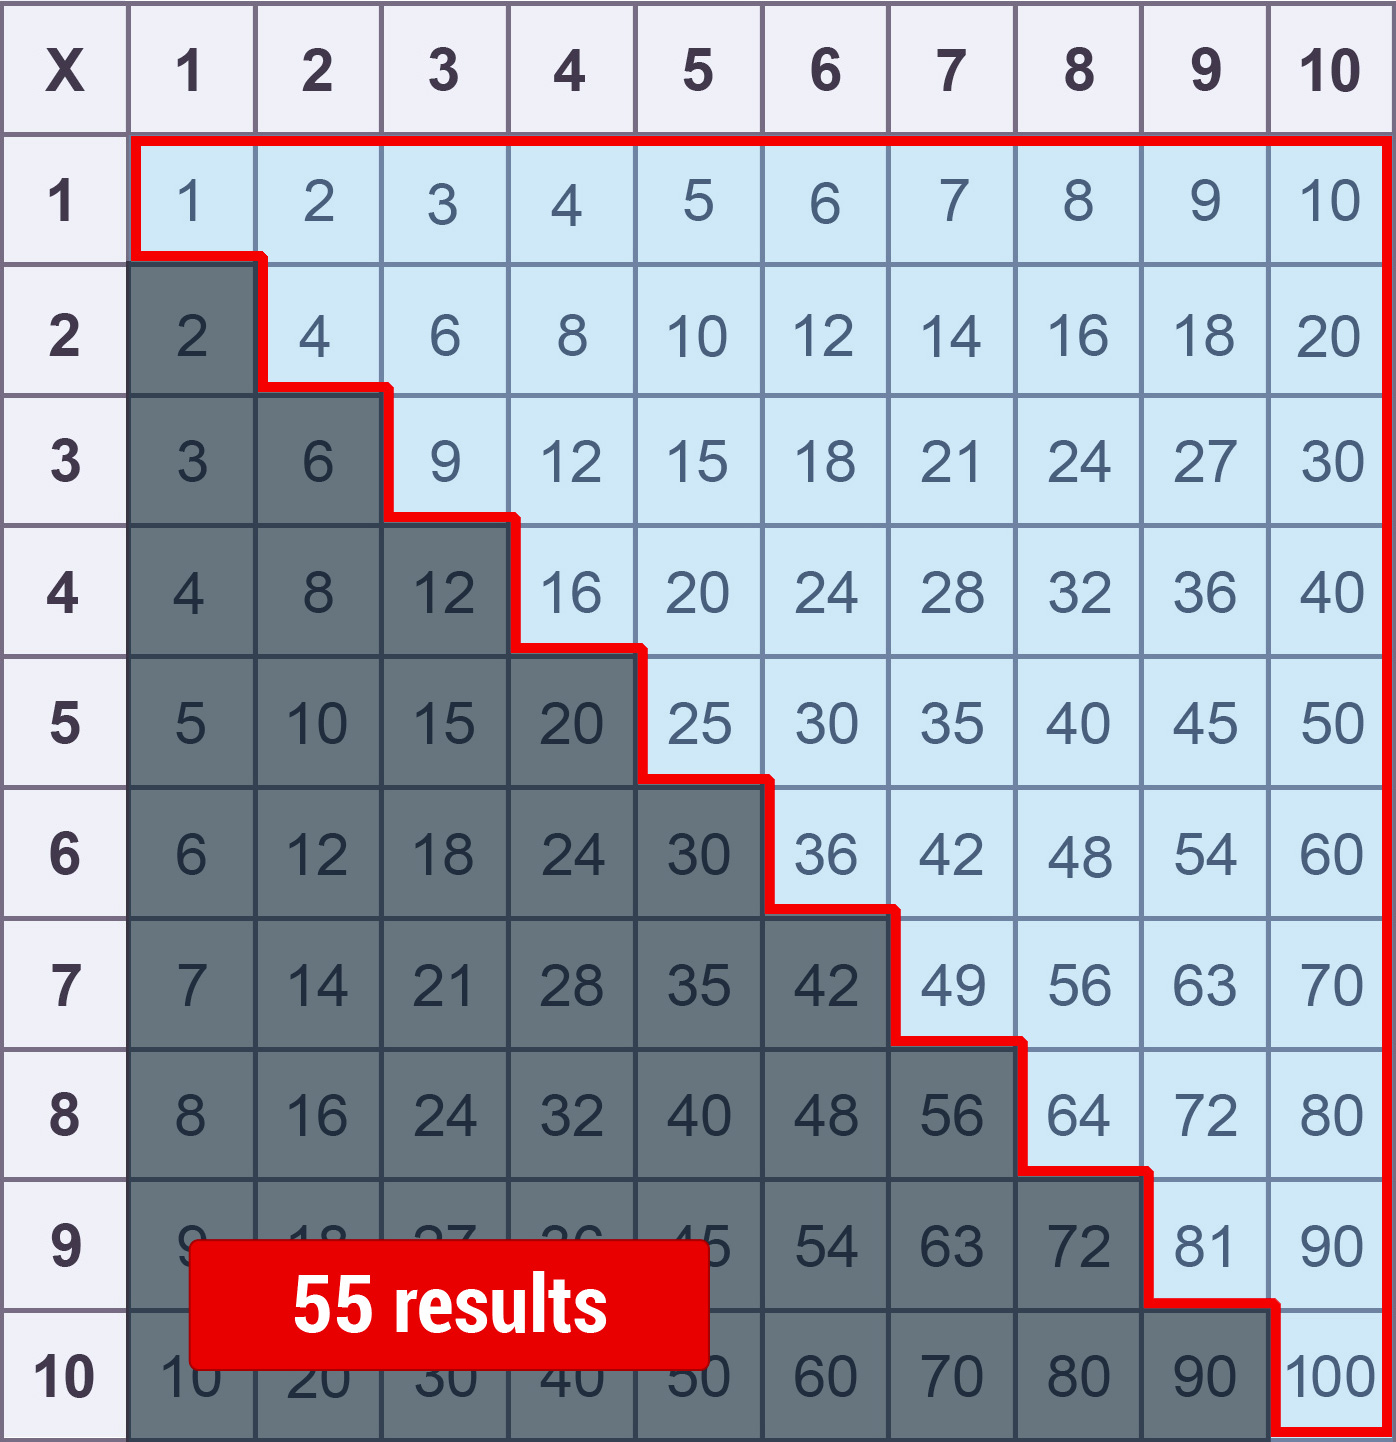 Number of results without duplicates
Skip the duplicates
Thanks to the commutative property of multiplication, many cells in the chart are equivalent: 3×4 gives the same result as 4×3. This creates a symmetry on either side of the diagonal, which means we can remove all the results below it.
Once these duplicates are removed, only 55 multiplications remain — and we can reduce that number even further!
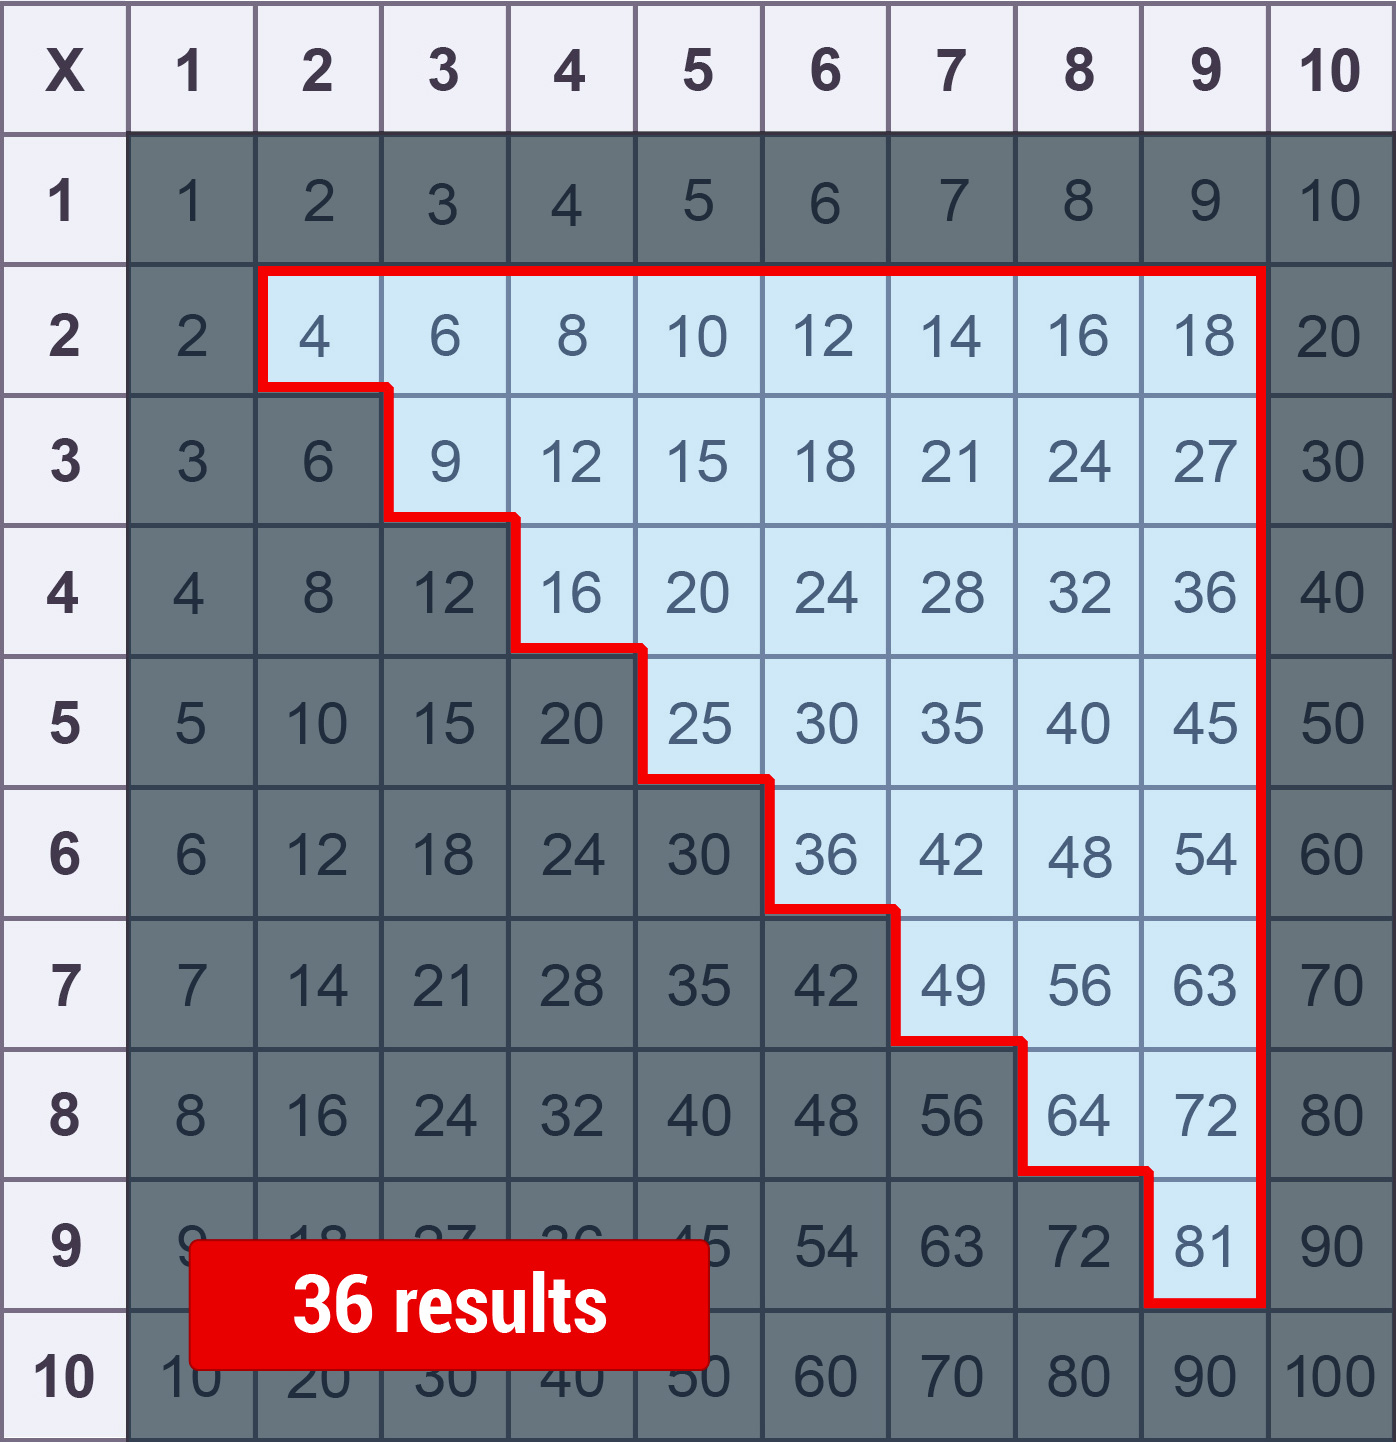 Real number of results to learn
No need to memorize the 1 and 10 times tables!
These two tables are the easiest of all — no memorization needed:
1 times table: any number multiplied by 1 always equals itself.
Example: 1×1=1, 1×2=2, 1×3=3, 1×4=4…
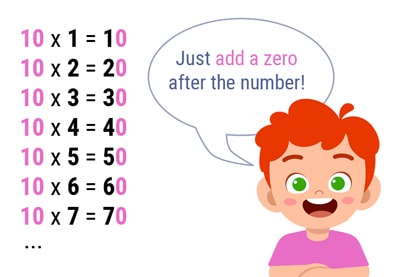
10 times table: any number multiplied by 10 always equals the number followed by a zero.
Example: 1×10=10, 2×10=20, 3×10=30, 4×10=40…
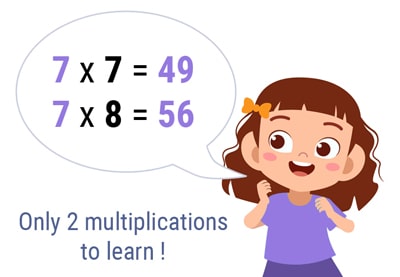
And there you have it! Only 36 multiplications left to learn. Pretty reassuring, right?
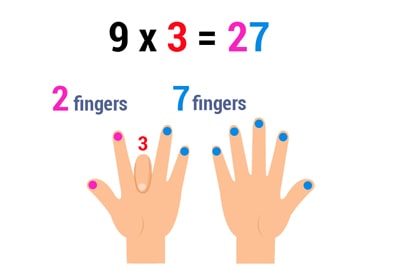
Note: Between us, you can bring that number down to just 28 multiplications using the finger trick for the 9 times table!
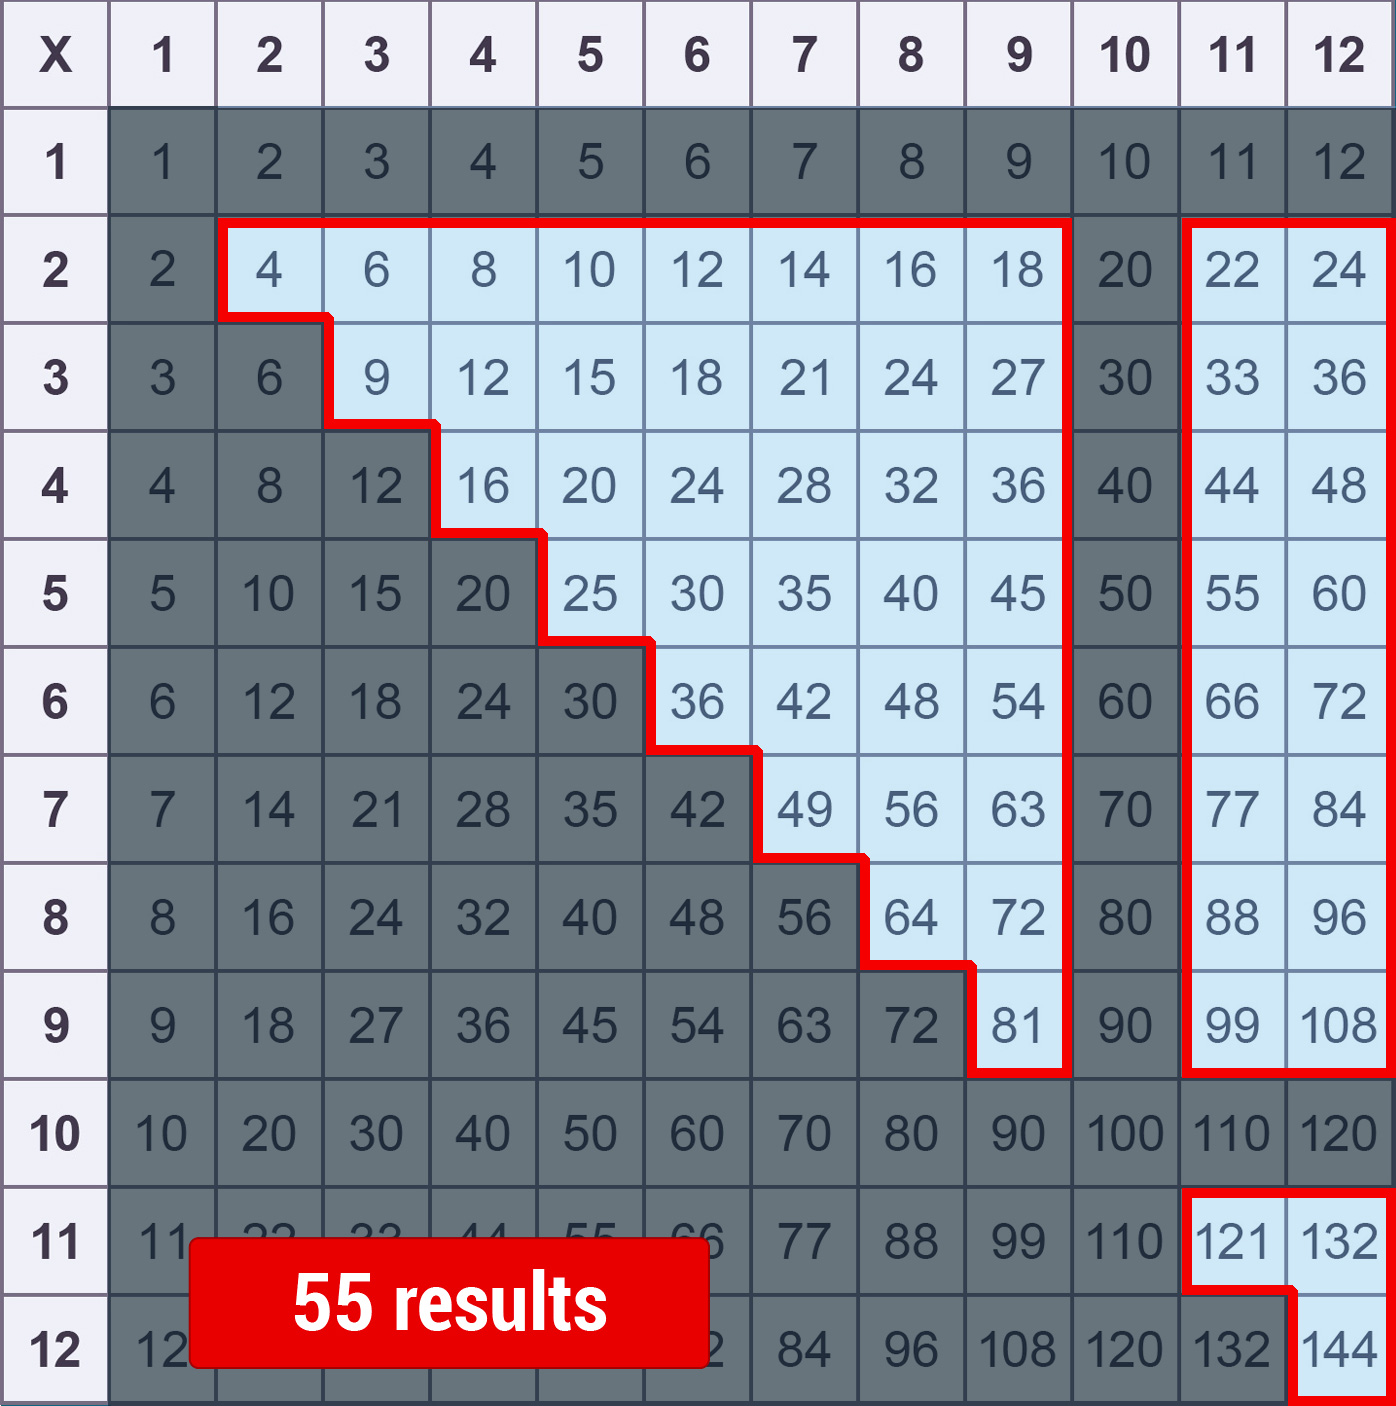 Real number of results to learn in a 12×12 chart
And what about a 12×12 chart?
A 1-12 multiplication chart contains 144 results. Once all duplicates are removed — along with the 1 and 10 times tables — only 55 multiplications remain.
Note: Here too, tricks exist for the 9, 11, and 12 times tables. Apply them all, and there are truly only 28 multiplications to know by heart!
3- Tricks for each times table: save time!
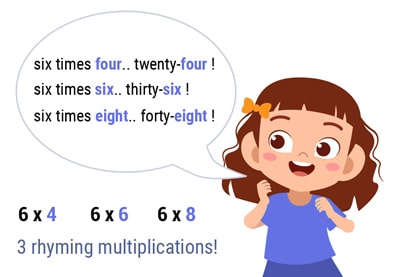
As you saw above, there are 55 multiplications to know in a 12×12 chart. But with our tricks for each times table, you'll memorize them even faster and save a ton of time! And if you want to go beyond the 10 times table, we also have tricks for the 11 and 12 times tables.


Discover more of our times tables tools
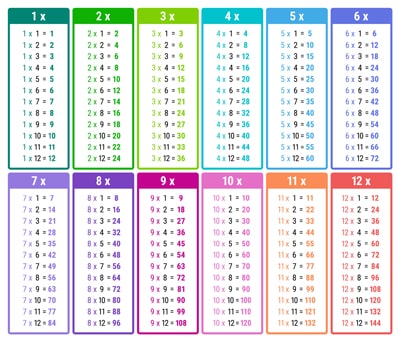
Times Tables: the complete poster (2-page PDF to cut and assemble)
A colorful, ready-to-print poster featuring all the times tables, from 1 to 12. Each multiplication table has its own color, with a nice color gradient across the whole poster. The colors make it easier for your child to memorize every times table (other color options are also available).